

Economic Calendar India Today – Thursday, 15 October 2026: Trade Data Released
October 15, 2026 | by NammaStockMarket
Thursday, 15 October 2026 (IST) | Last updated 5:45 PM IST
Welcome to today’s Economic Calendar India update. Today’s major Indian data release is the merchandise trade data for September 2026, published by the Ministry of Commerce and Industry. The numbers are already out, so this page lays out what they show, how they compare with earlier months, and why traders and long-term investors in the Indian stock market keep an eye on exports, imports and the trade deficit.
Economic Calendar India – Today’s Key Events
| Time (IST) | Economic Indicator | Reporting Period | Previous Data | Forecast | Why It Matters |
|---|---|---|---|---|---|
| Around 3:00 PM† | India merchandise trade data. Released: exports $44.40 bn, imports $74.61 bn, trade deficit $30.21 bn | September 2026 | Aug 2026 deficit: $26.86 bn (Sep 2025: $33.00 bn) | About -$29.5 bn deficit (Trading Economics forecast, not an official consensus) | Shows the external sector’s health and gives a clue about pressure on the rupee |
† Timing note: media reports carried the data from about 3:00 PM IST, and the Commerce Secretary briefed the press the same afternoon. The exact official release time was not separately verified. The forecast is a single third-party estimate and should be read with caution.
Understanding Today’s Economic Indicators
Merchandise Trade: Exports, Imports and the Trade Deficit
Merchandise trade covers physical goods that India sells abroad (exports) and buys from abroad (imports). The gap between the two is the trade deficit. India has run a trade deficit for many years, mainly because of large imports of crude oil, gold, electronics and machinery. The Ministry of Commerce publishes the data around the middle of every month, and it is usually quoted in US dollars.
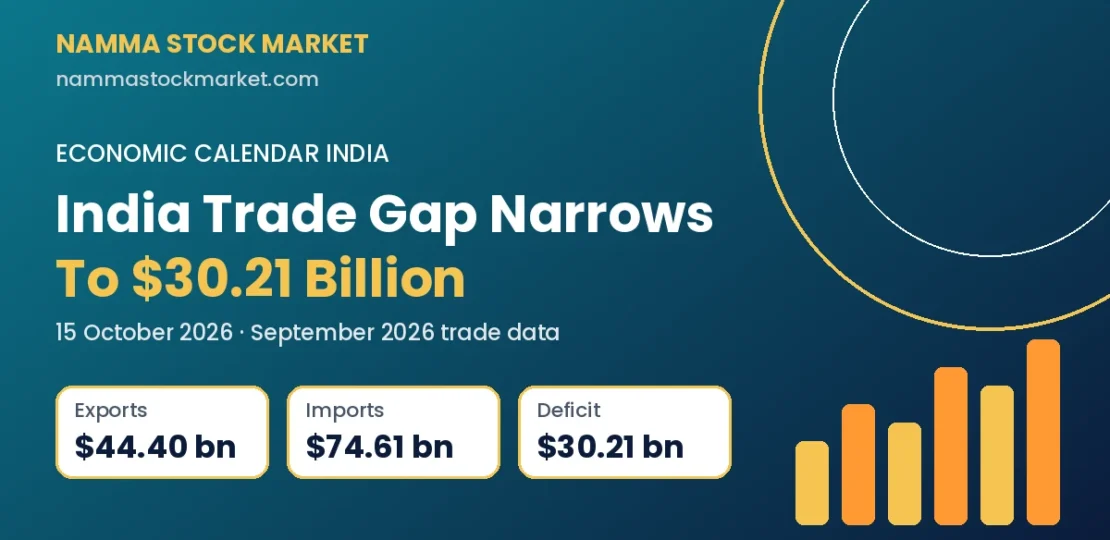
What the data shows (official facts, as reported). In September 2026, merchandise exports rose about 23% year on year to $44.40 billion, up from $36.08 billion in September 2025. Imports rose about 8% to $74.61 billion from $69.08 billion. The merchandise trade deficit came in at $30.21 billion, narrower than the $33.00 billion of September 2025. The ministry’s estimate for total trade, which adds services, puts exports at $80.75 billion and the overall deficit at $13.30 billion, against $14.17 billion a year earlier. Higher shipments of electronic goods, petroleum products, engineering goods, chemicals and agricultural products were cited as drivers.
Year-to-date picture. Media reports put cumulative April–September 2026 merchandise exports at about $259.89 billion (up 18.51%) and imports at about $437.53 billion (up 16.31%). Cumulative figures can differ slightly from the sum of monthly numbers because earlier months get revised.
Market expectations. The only forecast we could find was a Trading Economics estimate of roughly -$29.5 billion for the deficit. The actual $30.21 billion was a little wider than that estimate, though still lower than a year ago. This is not an official consensus.
What to watch. Look at the split between oil and non-oil imports and at gold imports, which the headline reports did not detail. Also watch whether export growth stays strong after a high base, and whether the monthly deficit stays near $30 billion.
Possible market implications. A wider trade deficit can mean more demand for dollars, which may add some pressure on the rupee. Rupee moves matter for importers, oil marketing companies and IT exporters. Strong export growth can support export-oriented sectors such as engineering goods, chemicals and electronics. Banks and bond markets usually react more to inflation and RBI signals than to trade data alone, so this release is one input among many. These are possible relationships, not guaranteed reactions.
Historical Data of India’s Merchandise Trade Deficit
The table shows the merchandise trade deficit (imports minus exports) in US$ billion for the last six months. Figures are as first reported at each release and can be revised later.
| Reporting Period | Actual Deficit (US$ bn) | Previous Month’s Deficit (US$ bn) | Interpretation |
|---|---|---|---|
| September 2026 | 30.21 | 26.86 | Wider than August but narrower than Sep 2025 ($33.00 bn) |
| August 2026 | 26.86 | 31.98 | Lowest of the six months, as imports fell about 7% from July |
| July 2026 | 31.98 | 30.43 | Highest of the period; imports jumped to $76.22 bn |
| June 2026 | 30.43 | 28.21 | Exports dipped to $40.41 bn while imports stayed high |
| May 2026 | 28.21 | 28.38 | Almost unchanged from April |
| April 2026 | 28.38 | Not verified | Start of FY 2026-27 |
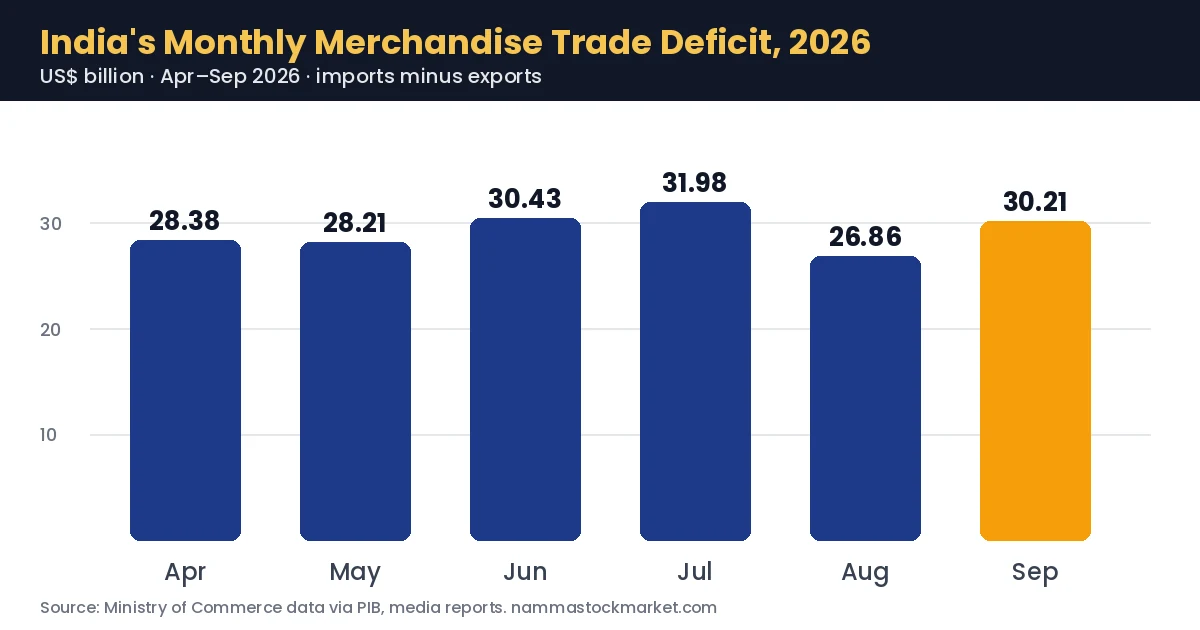
In simple words, the monthly deficit has stayed in a band of roughly $27–32 billion through FY 2026-27. August was the low point and July the high. September’s $30.21 billion sits in the middle of that range, so today’s reading does not signal a sudden change in direction. Sources: Ministry of Commerce releases on PIB for April, May and July; June and August figures from Canara Bank’s trade data note and Trading Economics.
Historical Data of India’s Merchandise Exports
| Reporting Period | Actual Exports (US$ bn) | Previous Month’s Exports (US$ bn) | Interpretation |
|---|---|---|---|
| September 2026 | 44.40 | 43.81 | Up about 1% on the month and 23% on the year |
| August 2026 | 43.81 | 44.24 | Broadly flat on July |
| July 2026 | 44.24 | 40.41 | Rebound of about 9% after a soft June |
| June 2026 | 40.41 | 45.20 | Seasonal dip; still up 15.5% on June 2025 |
| May 2026 | 45.20 | 43.56 | Up about 4% on April; 18% above May 2025 |
| April 2026 | 43.56 | Not verified | About 14% above April 2025 ($38.28 bn) |
Exports have stayed mostly between $40 billion and $45 billion a month, and September’s $44.40 billion is among the stronger readings of the period. Year-on-year growth has been in the mid-teens to over 20% in the months where we could verify it.
Historical Data of India’s Merchandise Imports
| Reporting Period | Actual Imports (US$ bn) | Previous Month’s Imports (US$ bn) | Interpretation |
|---|---|---|---|
| September 2026 | 74.61 | 70.67 | Up about 6% on August; about 8% above Sep 2025 |
| August 2026 | 70.67 | 76.22 | Fell about 7% from July’s high |
| July 2026 | 76.22 | 70.84 | Highest of the six months |
| June 2026 | 70.84 | 73.41 | Down about 3.5% on May, but 31% above June 2025 |
| May 2026 | 73.41 | 71.94 | Up 2% on April |
| April 2026 | 71.94 | Not verified | About 10% above April 2025 ($65.38 bn) |
Imports have moved between about $71 billion and $76 billion a month. Because imports are far larger than exports, even small swings in imports decide whether the deficit widens or narrows, as seen in July and August. Sources: PIB (April, May, July), Canara Bank (June), Trading Economics (August), and media reports based on the ministry’s data (September).
How Could Today’s Economic Data Affect the Indian Stock Market?
Trade data does not usually move the Nifty 50 or Sensex on its own, but it feeds into a few channels that investors follow:
- Rupee and imports. A larger deficit means India pays out more dollars than it earns. Over time this can weigh on the rupee, which raises the cost of imported crude oil and electronics.
- Sector earnings. Stronger exports can help engineering, chemicals, pharma and electronics companies. IT services are counted under services, not goods.
- Inflation and RBI. A weaker rupee can push up imported inflation, which the RBI considers when it looks at interest rates. See our note on September’s CPI inflation data for the latest retail inflation reading.
- Foreign flows. The external balance is one factor foreign institutional investors (FIIs) weigh when judging India’s macro stability.
Markets react to many things at once, including global cues, crude oil and FII flows, so the effect of any single release can be small or short-lived.
What Should Indian Investors Watch Today?
- Whether the official split of oil, gold and non-oil imports shows what drove the 8% rise in imports.
- How the rupee behaves against the dollar in the coming sessions, given a deficit near $30 billion.
- Whether export growth above 20% year on year can continue as the base gets higher.
- The next data points: October trade data in mid-November and the October CPI on 12 November. For the day’s market setup, see our pre-market report for 15 October 2026.
Frequently Asked Questions
What is the Economic Calendar India?
It is a schedule of important Indian data releases such as CPI, WPI, IIP, PMI, GDP, trade data and RBI policy decisions, along with the date, time and previous readings. Investors use it to know when new information about the economy is due.
Where can I check the India economic calendar today?
Official release calendars are published by MoSPI, the Office of the Economic Adviser (DPIIT), the RBI and the Ministry of Commerce. Our daily Economic Calendar India page also lists verified releases for the day.
Which economic indicators matter most for the Indian stock market?
Retail inflation (CPI), the RBI’s repo rate decisions, GDP growth, IIP, PMI and trade data are among the most closely followed. Which one matters most depends on the market situation at that time.
What is the difference between CPI and WPI?
CPI measures price changes faced by consumers, while WPI tracks wholesale prices of goods traded in bulk. The RBI uses CPI as its main inflation guide.
How can economic data affect Nifty 50 and Sensex?
Data can change expectations about interest rates, company earnings and the rupee, which in turn can influence share prices. Reactions vary and are never certain.
Conclusion
India’s September 2026 trade data showed exports up about 23% to $44.40 billion, imports up about 8% to $74.61 billion and a merchandise trade deficit of $30.21 billion, narrower than a year ago but wider than August. Over the last six months the deficit has stayed within a fairly steady range. Investors will want to track the rupee, oil and gold imports and the next releases for a fuller picture.
Data sources: Ministry of Commerce and Industry releases on PIB (July 2026), PIB April 2026, PIB May 2026, Canara Bank trade data note (June 2026), Trading Economics (August 2026 and forecast), Business Today and Devdiscourse/ANI (September 2026). The official PIB release for September 2026 could not be separately accessed at the time of writing; figures are as reported by the media from the Ministry’s data and may be revised. Merchandise deficit for April, May and July is calculated as imports minus exports.
This article is for informational and educational purposes only and does not constitute investment advice. Please consult a SEBI-registered investment advisor before making any trading or investment decisions.
RELATED POSTS
View all

Economic Calendar India Today – Monday, 12 October 2026: CPI Inflation Data Released
October 12, 2026 | by NammaStockMarket