

Economic Calendar India Today – Monday, 12 October 2026: CPI Inflation Data Released
October 12, 2026 | by NammaStockMarket
Date: Monday, 12 October 2026 (IST) | Last updated 6:00 PM IST
Welcome to today’s Economic Calendar India update. Only one major Indian data release was on the schedule today: the All India Consumer Price Index (CPI), which tells us how fast retail prices are rising. The figure for September 2026 is already out, so this page explains what the number says, how it compares with earlier months, and why investors in the Indian stock market follow it.
Economic Calendar India – Today’s Key Events
| Time (IST) | Economic Indicator | Reporting Period | Previous Data | Forecast | Why It Matters |
|---|---|---|---|---|---|
| 4:00 PM* | All India CPI (retail inflation, combined) – Released: 5.54% | September 2026 (provisional) | 4.83% (Aug 2026) | Not available | Guides RBI rate expectations, bond yields and household spending power |
*MoSPI’s standard release time. The August 2026 data was embargoed until 4:00 PM IST; the exact time for today’s release was not separately verified. Per MoSPI’s advance release calendar, CPI was the only release listed for 12 October. Next in line: IIP on 28 October and October CPI on 12 November.
Understanding Today’s Economic Indicators
Consumer Price Index (CPI) Inflation
CPI measures the change in prices of a fixed basket of goods and services that households buy, from vegetables and milk to rent, transport and school fees. The year-on-year figure compares prices with the same month a year earlier. It is India’s headline retail inflation number, and the RBI uses it as the benchmark for its inflation target of 4%, with a tolerance band of 2% to 6%. The series now uses 2024 as its base year (2024 = 100).
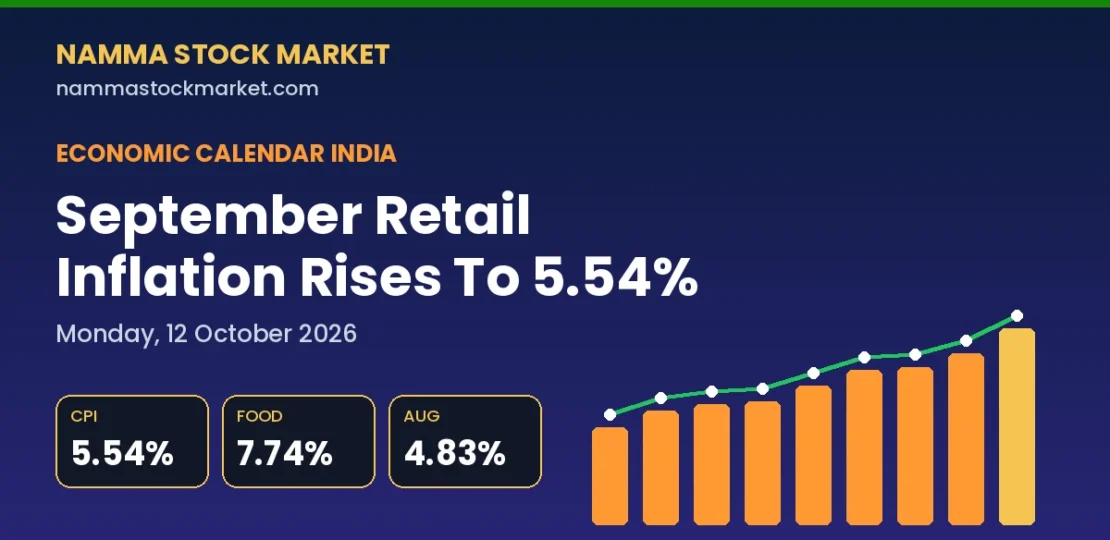
What the data shows (official facts). Retail inflation in September 2026 came in at 5.54%, up from 4.83% in August. Food inflation, measured by the Consumer Food Price Index (CFPI), rose to 7.74% from 5.97%. Both rural and urban areas saw prices rise faster, as the table below shows.
| Measure | Aug 2026 | Sep 2026 | Change (pp) |
|---|---|---|---|
| Combined CPI inflation | 4.83% | 5.54% | +0.71 |
| Rural CPI inflation | 5.24% | 6.08% | +0.84 |
| Urban CPI inflation | 4.31% | 4.88% | +0.57 |
| Combined food inflation (CFPI) | 5.97% | 7.74% | +1.77 |
| Rural food inflation | 6.17% | 8.06% | +1.89 |
| Urban food inflation | 5.64% | 7.18% | +1.54 |
The combined CPI index stood at 109.49 in September 2026. Onion prices were up 108.09% from a year earlier (48.78% in August), and ginger, garlic, lemons and silver jewellery also showed steep increases. Some items were cheaper than a year ago, including potato (-11.50%), tomato (-8.62%) and motor cars (-4.51%).
Among broad categories, the numbers were as follows:
| Division (combined) | Sep 2026 inflation |
|---|---|
| Personal care, social protection and miscellaneous | 13.75% |
| Restaurants and accommodation | 9.36% |
| Food and beverages | 7.36% |
| Transport | 5.01% |
| Education | 3.94% |
| Housing, water, electricity, gas and other fuels | 2.74% |
| Health | 1.40% |
Among larger states, Tamil Nadu (6.81%), Odisha (6.70%) and Madhya Pradesh (6.68%) recorded the highest headline inflation, while Delhi was at 3.40%.
Market expectations. A reliable, verified consensus forecast for this release was not available to us, so we are not quoting one.
What to watch. Since food made the biggest jump, watch whether vegetable prices, especially onions, ease in the coming weeks. Also note the policy backdrop: the RBI raised the repo rate (the rate at which it lends to banks) by 25 basis points to 5.50% on 7 October, as covered in our report on the RBI rate hike and market reaction.
Possible market implications (educational view). Higher inflation can raise expectations of tighter RBI policy, which may push up bond yields and borrowing costs. Rate-sensitive areas such as banks, autos and real estate often react to such shifts, while consumer companies may watch for pressure on household budgets. These are possible relationships, not certain outcomes.
Historical Data of CPI Inflation (All India, Combined)
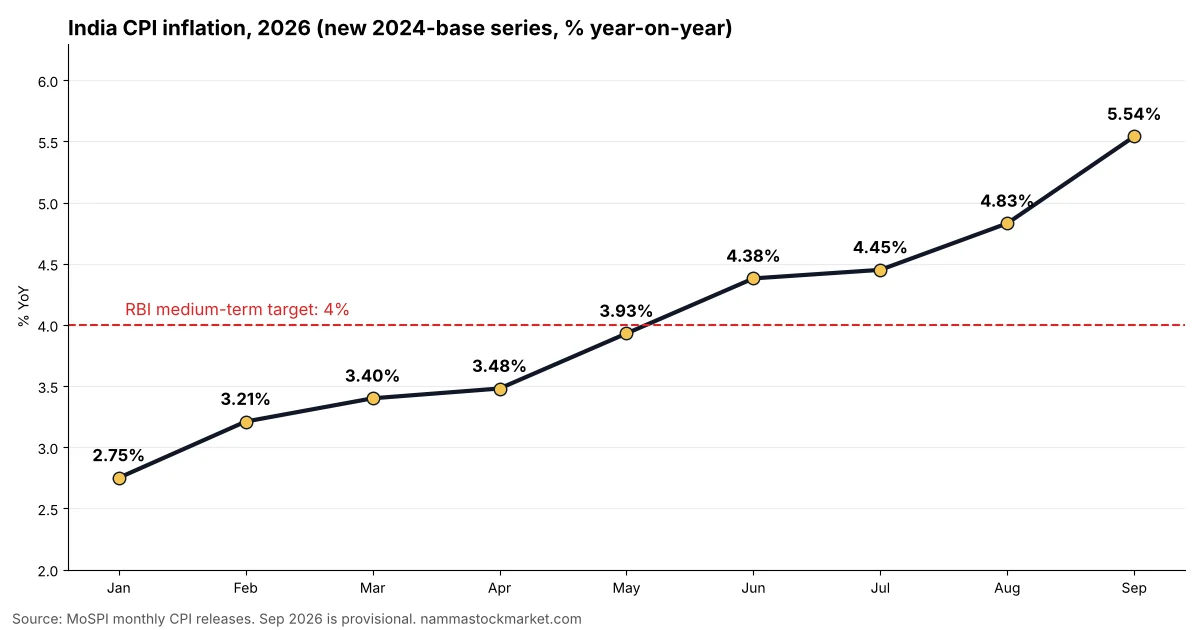
The table below shows year-on-year CPI inflation under the new 2024-base series, which started with January 2026 data. Older-series numbers are not comparable, so we have not mixed them in.
| Reporting Period | Actual Value | Previous Period’s Value | Interpretation |
|---|---|---|---|
| September 2026 (provisional) | 5.54% | 4.83% | Highest reading in the new series; food-led jump |
| August 2026 | 4.83% | 4.45% | Rise continued; first print was 4.82%, later revised |
| July 2026 | 4.45% | 4.38% | Marginal rise; final figure |
| June 2026 | 4.38% | 3.93% | First reading above the RBI’s 4% target in the new series |
| May 2026 | 3.93% | 3.48% | Sharper rise, close to 4% |
| April 2026 | 3.48% | 3.40% | Gradual increase |
| March 2026 | 3.40% | 3.21% | Modest rise on higher food prices |
| February 2026 | 3.21% | 2.75% | Up from the first reading |
| January 2026 | 2.75% | Not comparable | First print of the new series |
Retail inflation has risen in each of the nine months of this series, from 2.75% in January to 5.54% in September. It crossed the RBI’s 4% target in June and is now above 5%, though still inside the 2% to 6% tolerance band. January to June values are as first reported by MoSPI and may have been revised; September remains provisional. Source: MoSPI press release for August 2026, MoSPI April 2026 release and MoSPI’s official website.
How Could Today’s Economic Data Affect the Indian Stock Market?
Think of inflation data as one link in a chain. Rising inflation can lead people to expect that the RBI may keep interest rates higher for longer. Higher rates can make loans costlier for companies and households, and can make bonds look more attractive compared with equities. Costlier food can also reduce what families have left to spend on other things, which matters for consumption-linked sectors.
Other releases connect in similar ways. IIP shows how fast factories, mines and power plants are producing. GDP shows the overall pace of growth. Trade data shows the external side, including pressure on the rupee. Markets look at all of these together, and the reaction to any one number can differ from what textbooks suggest. For daily moves, you can follow our market wrap on the Sensex and Nifty after the RBI hike.
What Should Indian Investors Watch Today?
- Food versus overall inflation: Food inflation (7.74%) rose faster than the headline number (5.54%), so food prices are the main driver to follow.
- Rural and urban gap: Rural inflation (6.08%) is higher than urban (4.88%), which may matter for rural demand-linked sectors.
- RBI’s next steps: The repo rate is now 5.50% after the 7 October hike. Future RBI communication on inflation is worth tracking.
- Upcoming data: IIP on 28 October and October CPI on 12 November will show whether this trend continues.
Frequently Asked Questions
What is the Economic Calendar India?
It is a schedule of important Indian economic data releases and policy events, such as CPI, WPI, IIP, GDP, PMI, trade data and RBI policy decisions, with dates and times.
Where can I check India’s economic calendar today?
MoSPI publishes an advance release calendar on its website, and the RBI publishes its own policy and data schedule. Market data platforms also list releases day by day.
Which indicators matter most for the Indian stock market?
CPI inflation, RBI policy decisions, GDP growth, IIP, PMI and trade data are widely followed because they affect interest rate expectations, corporate earnings outlook and the rupee.
What is the difference between CPI and WPI?
CPI tracks prices paid by consumers at the retail level. WPI tracks prices at the wholesale level, before goods reach consumers. The RBI mainly uses CPI as its inflation benchmark.
How can economic data affect Nifty 50 and Sensex?
Data can change expectations about interest rates, growth and corporate profits, and that can influence market sentiment. The impact varies, and markets do not always react in a predictable way.
Conclusion
Today’s Economic Calendar India had one key event: September CPI inflation, which rose to 5.54% from 4.83% as food prices climbed sharply. It is the highest reading in the new series so far, and it arrives days after the RBI’s repo rate hike. The next data points to follow are IIP on 28 October and October CPI on 12 November.
Data sources: MoSPI (CPI press releases and advance release calendar), RBI, and published news reports for September 2026 CPI details. Figures are provisional where stated.
This article is for informational and educational purposes only and does not constitute investment advice. Please consult a SEBI-registered investment advisor before making any trading or investment decisions.