

Economic Calendar India Today – Monday, 2 November 2026: Manufacturing PMI for October
November 2, 2026 | by NammaStockMarket
Monday, 2 November 2026 (IST) | Last updated 5:56 PM IST
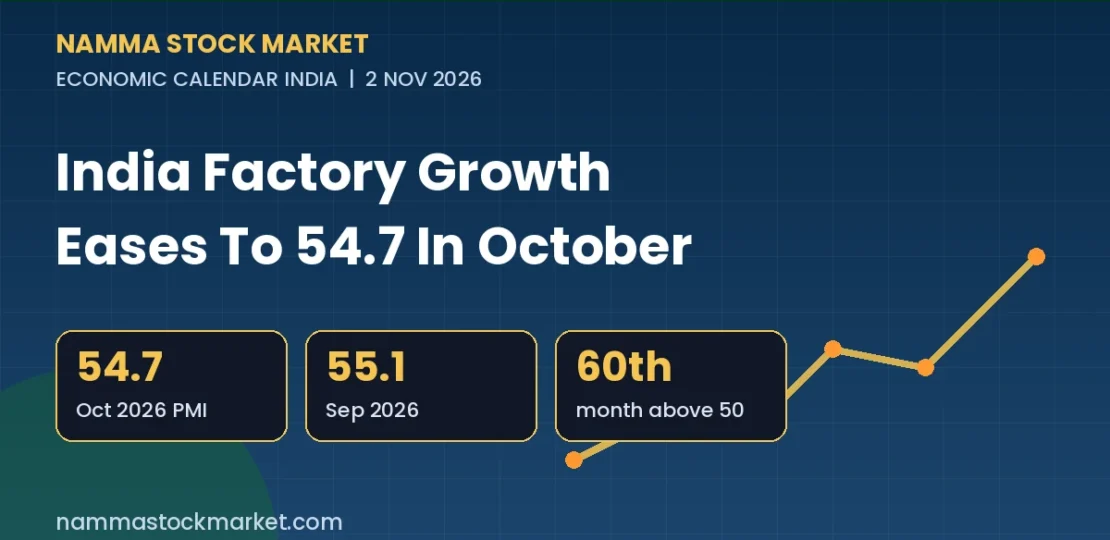
Welcome to today’s Economic Calendar India update. The one Indian data release scheduled for today is the final HSBC India Manufacturing PMI for October 2026, compiled by S&P Global. It is already out: the index eased to 54.7 from 55.1 in September, but stayed well above the 50 mark that separates growth from contraction. This page explains what the number shows, how it compares with the last few months, and why investors in the Indian stock market follow it.
Economic Calendar India – Today’s Key Events
| Time (IST) | Economic Indicator | Reporting Period | Previous Data | Forecast | Why It Matters |
|---|---|---|---|---|---|
| Not available† | HSBC India Manufacturing PMI (final). Released: 54.7 | October 2026 | 55.1 (September, final) | Not available‡ | Shows whether factory orders, output and hiring are expanding or slowing |
† The 2 November release date is confirmed by Business Standard’s weekly policy watch, but a release time in IST was not stated in the sources checked. ‡ No reliable consensus forecast for the final October reading could be verified. The earlier flash (preliminary) estimate for October was 54.9, as reported by Trading Economics; that is an early estimate, not a market forecast. Other Indian releases due this week are the HSBC India Services PMI (final) on 4 November and RBI forex reserves data on 6 November, per the same Business Standard preview.
Understanding Today’s Economic Indicators
HSBC India Manufacturing PMI (October 2026)
What it is. The Purchasing Managers’ Index (PMI) is a monthly survey of purchasing managers at private manufacturing companies. They are asked whether things like new orders, output, employment, supplier delivery times and stocks of purchases are higher, lower or unchanged compared with the previous month. A reading above 50 means the sector is expanding; below 50 means it is shrinking. The further from 50, the stronger the move.
Why it matters for India. PMI is among the earliest hard signals of how the economy is doing, because it arrives within days of the month ending. Official numbers such as the Index of Industrial Production (IIP) come with a lag of several weeks. Investors, analysts and the RBI all watch it for a quick read on demand and business conditions.
Previous reading. September 2026 stood at 55.1 (final), a sharp pick-up from 52.8 in August. The September final was slightly below its flash estimate of 55.7.
What the October survey says. As reported by ANI, citing S&P Global:
- Growth in new business stayed strong, helped by favourable demand, new client wins and marketing efforts.
- New export orders rose at the fastest pace in six months, with demand from markets such as the US, UK, UAE and Saudi Arabia.
- Factory output rose sharply, although production growth softened from September.
- Employment rose for the second month in a row, but only slightly.
- Input cost inflation fell to its lowest since February, and selling prices rose at the weakest pace in just under four years.
- Business confidence slipped from September and remained below its long-run average.
The index has now stayed above 50 for 60 consecutive months, according to Indian Opinion.
What to watch. The 54.7 print is a touch below the 54.9 flash estimate, so the “revision” is small. The more interesting details are export orders (six-month high), softer price pressures, and the fact that finished-goods inventories rose at an unusually fast pace, which can mean either stocking up for expected demand or unsold goods, depending on the coming months. Business Standard notes that the July–September (Q2 FY27) average of 53.8 was the lowest for that quarter since 2021, so the sector is strong but not as strong as in earlier years.
Possible market implications. Steady PMI readings can support the view that corporate earnings in manufacturing-linked sectors such as autos, capital goods, metals and chemicals remain on track. Cooling input and output prices can ease worries about inflation, which matters for rate expectations, bond yields and banking stocks. Strong export orders are watched for their possible link to the rupee and the external sector. These are possible relationships, not guaranteed reactions, and markets weigh PMI alongside global cues, FII flows and company results.
Historical Data of HSBC India Manufacturing PMI
| Reporting Period | Actual Value | Previous Period’s Value | Interpretation |
|---|---|---|---|
| October 2026 | 54.7 | 55.1 | Eased slightly; flash was 54.9 |
| September 2026 | 55.1 | 52.8 | Sharp rebound from August; flash was 55.7 |
| August 2026 | 52.8 | 53.5 | Weakest of the six months |
| July 2026 | 53.5 | 54.2 | Softer growth; flash was 53.9 |
| June 2026 | 54.2 | 55.0 | Eased from May |
| May 2026 | 55.0 | Not available§ | Strong expansion |
All values are final PMI readings from the same survey. Sources: Trading Economics (August to October), Sahi (May to July), Business Standard and ANI. § The April 2026 reading appears as 54.7 in one source and 55.9 (flash) in another, and could not be reconciled, so it is not shown. One data aggregator lists August as 52.9, which is the flash figure; the final is 52.8.
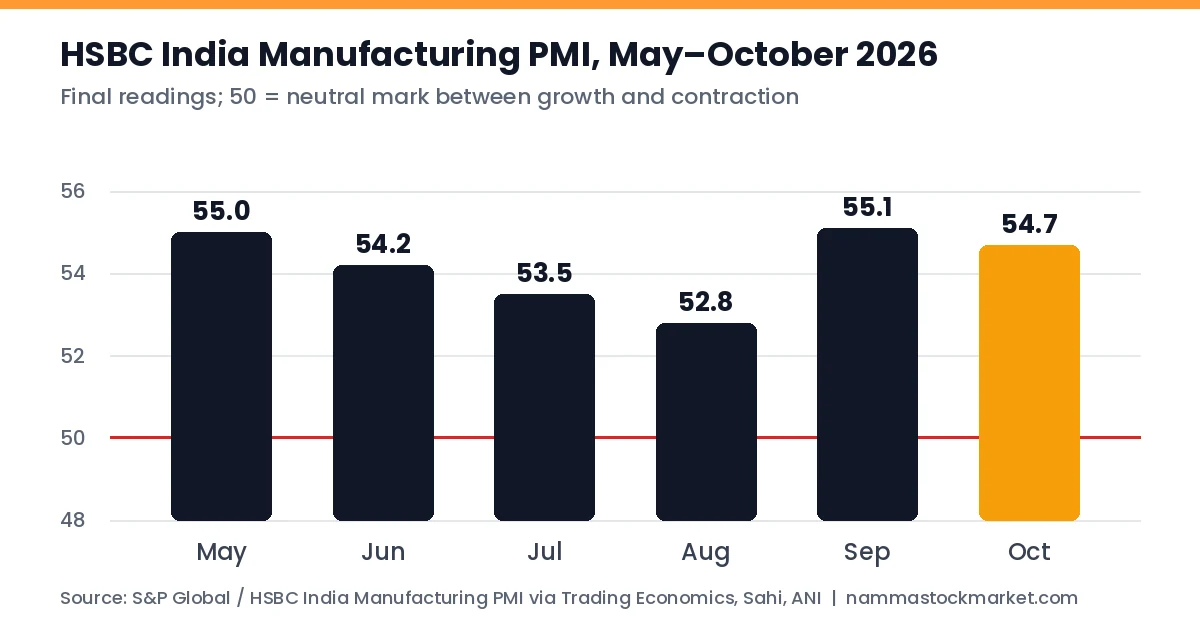
In simple words: over the last six months the PMI has moved in a band of roughly 52.8 to 55.1, always comfortably in expansion territory. It slid from 55.0 in May to 52.8 in August, bounced back in September and has eased a little in October. The trend is “healthy but not accelerating”. Official source: S&P Global PMI.
How Could Today’s Economic Data Affect the Indian Stock Market?
Economic data does not move the market in a straight line, but it can change expectations. A few possible channels:
- Growth and earnings. A PMI well above 50 suggests factories are seeing more orders, which can support revenue expectations for manufacturing-linked companies.
- Inflation and interest rates. Easing input and selling prices can reduce pressure on the RBI to keep borrowing costs high, which banks, NBFCs and rate-sensitive sectors such as real estate pay attention to.
- Bond yields. Softer price pressures can influence expectations for government bond yields.
- External sector and rupee. Higher export orders may add to the positive view on India’s trade performance, which the rupee market tracks along with oil prices and foreign fund flows.
- Sentiment. A small dip from 55.1 to 54.7 is unlikely, on its own, to change the broader picture; traders often look at whether the trend is improving or fading rather than a single month.
For daily market context, see our pre-market report for 2 November 2026 and our earlier look at IIP data for September.
What Should Indian Investors Watch Today?
- Headline versus trend: 54.7 is lower than September but above the neutral 50, and well above the six-month low of 52.8 in August.
- Export orders: The six-month high is a detail that analysts follow for clues on external demand.
- Prices: Cooling input costs and the weakest selling-price rise in nearly four years are relevant for the inflation outlook.
- Hiring and confidence: Slight job additions and below-average business confidence suggest firms remain cautious.
- Next data points: The services PMI on 4 November and RBI forex reserves on 6 November complete this week’s picture. See our forex reserves update for the most recent reading.
Frequently Asked Questions
What is the Economic Calendar India?
It is a schedule of important Indian economic data releases and events, such as inflation, IIP, GDP, PMI, trade data, forex reserves and RBI policy decisions, along with their timing and previous readings.
Where can I check India’s economic calendar today?
Official release calendars are published by MoSPI, the RBI and the Office of the Economic Adviser. PMI releases come from S&P Global. This page summarises the day’s verified releases.
Which indicators matter most for the Indian stock market?
Inflation (CPI and WPI), RBI policy decisions, GDP growth, IIP, PMI, trade data and forex reserves are widely followed. Their importance can change depending on what is happening in the economy.
What is the difference between CPI and WPI?
CPI measures price changes faced by consumers, such as food, fuel and housing. WPI measures price changes at the wholesale level before goods reach consumers.
How can economic data affect Nifty 50 and Sensex?
Data can change expectations about interest rates, company earnings and the rupee, which in turn can influence the Nifty 50 and Sensex. Reactions vary and are never certain.
Conclusion
The final HSBC India Manufacturing PMI for October 2026 came in at 54.7, down from 55.1 in September and slightly below the 54.9 flash estimate, but still firmly in expansion territory for the 60th month in a row. Export orders hit a six-month high, while price pressures cooled. The data points to steady factory activity rather than a sharp acceleration.
Data sources: PMI figures as reported by ANI, Business Standard, Trading Economics, Indian Opinion and Sahi, based on the HSBC India Manufacturing PMI compiled by S&P Global. The S&P Global release itself could not be accessed directly at the time of writing, and figures may be revised.
This article is for informational and educational purposes only and does not constitute investment advice. Please consult a SEBI-registered investment advisor before making any trading or investment decisions.
RELATED POSTS
View all

Economic Calendar India Today – Monday, 12 October 2026: CPI Inflation Data Released
October 12, 2026 | by NammaStockMarket
Economic Calendar India Today – Wednesday, 28 October 2026: IIP Data for September Released
October 28, 2026 | by NammaStockMarket
Economic Calendar India Today – Friday, 16 October 2026: RBI Forex Reserves Data
October 16, 2026 | by NammaStockMarket