

Economic Calendar India Today – Wednesday, 28 October 2026: IIP Data for September Released
October 28, 2026 | by NammaStockMarket
Wednesday, 28 October 2026 (IST) | Last updated 5:57 PM IST
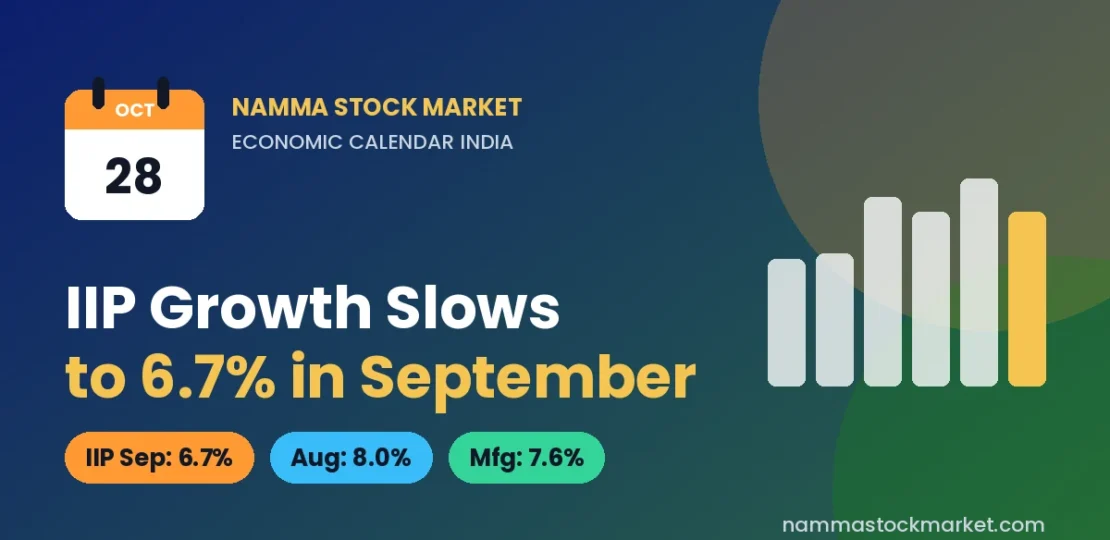
Welcome to today’s Economic Calendar India update. The key Indian data release scheduled for today is the Index of Industrial Production (IIP) for September 2026, published by the Ministry of Statistics and Programme Implementation (MoSPI). The number is already out: industrial output grew 6.7% year-on-year. This page explains what the figure shows, how it compares with the earlier months of the new IIP series, and why investors in the Indian stock market follow it.
Economic Calendar India – Today’s Key Events
| Time (IST) | Economic Indicator | Reporting Period | Previous Data | Forecast | Why It Matters |
|---|---|---|---|---|---|
| 4:00 PM* | Index of Industrial Production (IIP). Released: 6.7% YoY | September 2026 | 8.0% (August, quick estimate) | 7.3%** | Shows how fast factories, mines and power plants are growing |
*The 4:00 PM IST timing is as reported by Finimize; MoSPI’s advance release calendar confirms the date but the time was not separately verified. **Forecast is a Reuters poll median as reported by Finimize, not an official number. The actual figure of 6.7% came in below that poll. Other aggregator calendars list additional items for today (such as weekly money supply data), but these could not be verified from an official source, so they are not covered here.
Understanding Today’s Economic Indicators
Index of Industrial Production (IIP)
What it is. The IIP is a monthly index that tracks how much India’s factories, mines and power plants are producing compared with a base year. MoSPI’s National Statistics Office (NSO) publishes it. The headline figure is usually quoted as a year-on-year (YoY) growth rate, meaning September 2026 output is compared with September 2025.
Why it matters for India. Manufacturing carries the largest weight in the index, so IIP is a quick read on industrial activity, which feeds into company sales, jobs and tax collections. Investors in capital goods, auto, metals and power companies often watch it for a sense of demand.
What was released. The IIP index stood at 124.3 in September 2026 against 116.5 a year earlier, which is YoY growth of 6.7%. In August 2026 growth was 8.0% as a quick estimate, so the pace cooled by 1.3 percentage points month on month. This is a quick estimate, so MoSPI may revise it in the next release.
Market expectations. A Reuters poll, as cited by Finimize, had pointed to growth of 7.3%. The released figure was lower than that poll.
Sector details reported. Manufacturing grew 7.6% (index 128.0), and electricity and gas supply grew 11.2% (index 128.6). The mining index was 90.4 and the water supply, sewerage and waste management index was 146.4; growth rates for these two were not stated in the reports we could verify. Of the 23 two-digit manufacturing industry groups, 17 showed growth over September 2025. By use-based category, the indices were: capital goods 153.4, consumer durables 133.1, consumer non-durables 111.8, intermediate goods 131.7, infrastructure/construction goods 133.0 and primary goods 111.6. Intermediate goods, primary goods and capital goods were named as the top contributors to growth. IANS also names electrical equipment, rubber and plastics products, and motor vehicles among the strongest manufacturing groups.
| Segment | September 2026 Growth (YoY) | September 2026 Index |
|---|---|---|
| Overall IIP | 6.7% | 124.3 |
| Manufacturing | 7.6% | 128.0 |
| Electricity and gas supply | 11.2% | 128.6 |
| Mining and quarrying | Not available | 90.4 |
| Water supply, sewerage and waste management | Not available | 146.4 |
What to watch. Whether August and September get revised in the next release, whether mining stays weak, and whether manufacturing growth holds above 7%. One report on today’s release cited August manufacturing growth at 8.6%, against 9% in the earlier quick estimate, which suggests August was revised; the revised August headline figure was not verified at the time of writing.
A note on the new series. The IIP now uses 2022-23 as its base year, replacing 2011-12, with the first release under the new series covering April 2026. MoSPI also replaced the Wholesale Price Index (WPI) with the Output Producer Price Index (PPI) as the deflator, which converts value-based output into volumes. Figures in the old and new series are not directly comparable.
Historical Data of IIP (Index of Industrial Production)
The table below shows the headline IIP growth rate for every month released so far under the new 2022-23 series. All values are YoY growth in per cent. “Actual” is the quick estimate as first released; “Revised” shows the later revision where we could verify one.
| Reporting Period | Actual (Quick Estimate) | Previous Month, as Stated in That Release | Revised Later | Interpretation |
|---|---|---|---|---|
| September 2026 | 6.7% | 8.0% | Not available | Slower than August and below the Reuters poll of 7.3% |
| August 2026 | 8.0% | 7.4% (July, revised) | Not available | Strong first reading; manufacturing grew 9% |
| July 2026 | 6.7% | 8.8% (June, revised) | 7.4% | Mining contracted; revised up by 0.7 points |
| June 2026 | 7.3% | 5.0% (May, final) | 8.8% | Fastest in nearly two years at first release; later revised up sharply |
| May 2026 | 5.1% | Not available | 5.0% | Moderate growth; mining contracted 1.6% |
| April 2026 | 4.9% | 4.1% (March, old base; not comparable) | Not available | First print under the new base year; manufacturing grew 6.2% |
The April 2026 previous value is from the older 2011-12 series and is shown only for reference. The April and May releases did not state a comparable previous-month growth rate in the sources we checked. A revised August figure and any revision to September were not verified.
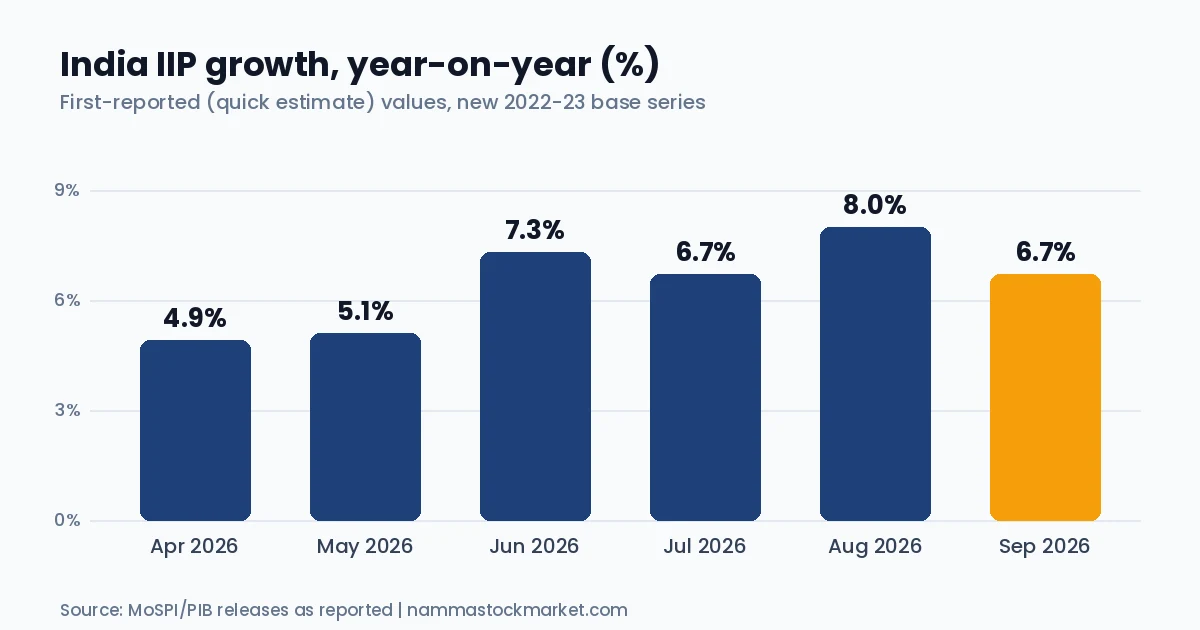
The chart above uses the first-reported values. The trend is one of gradual strengthening from April and May, a jump in June, and a range of roughly 6.7% to 8.0% since. Because revisions have often been upward (June went from 7.3% to 8.8%, July from 6.7% to 7.4%), the first reading of a month should be treated as a starting point rather than a final number.
For context, here is how the three main sectors have moved over the same period, as first reported (YoY %).
| Reporting Period | Manufacturing | Mining and Quarrying | Electricity and Gas Supply |
|---|---|---|---|
| September 2026 | 7.6% | Not available | 11.2% |
| August 2026 | 9.0% | -5.6% | 12.3% |
| July 2026 | 7.3% | -0.9% | 8.7% |
| June 2026 | 7.8% | 1.0% | 10.6% |
| May 2026 | 5.5% | -1.6% | 9.9% |
| April 2026 | 6.2% | -5.1% | 4.9% |
Manufacturing and electricity have carried the headline number in every month, while mining has been a drag in four of the five months for which we have a figure. In simple words: the factory and power side of the economy has been growing steadily, and the gap between months mostly comes from mining and from revisions.
How Could Today’s Economic Data Affect the Indian Stock Market?
Economic data does not move markets on its own. It changes what investors expect about growth, interest rates and company earnings. Some possible channels for today’s IIP number:
- Growth pace. Industrial output growing in the 6% to 8% range points to steady demand. A slowdown from the previous month, as seen today, may lead some investors to ask whether the earlier pace can be held, while others may treat it as normal month-to-month variation.
- Company earnings. Manufacturing growth can support revenue for sectors such as capital goods, autos, electrical equipment and metals. This is a possible relationship, not a guaranteed one, as company results depend on many other factors.
- Interest rate expectations. Strong activity data sits alongside inflation data when the RBI (Reserve Bank of India) thinks about the repo rate, the rate at which it lends to banks. Weaker data can sometimes support the case for lower rates and stronger data the opposite, but the RBI looks at many inputs.
- Surprise versus poll. Markets often react more to the gap between the actual figure and expectations than to the number itself. Today’s 6.7% came in below the 7.3% poll, but the market may also be reacting to Q2 earnings, FII (foreign institutional investor) and DII (domestic institutional investor) flows and global cues. You can read our Stock Market Today report for 28 October 2026 for the wider market picture.
What Should Indian Investors Watch Today?
- Any revision to the August and September IIP figures in MoSPI’s next release, and whether the trend changes.
- Whether manufacturing growth stays near the 7% to 9% range seen since June.
- Mining output, which has been the weakest component in most months.
- How the broader market treats the data alongside the busy Q2 earnings calendar and institutional flows.
Frequently Asked Questions
What is the Economic Calendar India?
It is a schedule of important Indian data releases such as CPI, WPI, IIP, PMI, GDP, trade data, forex reserves and RBI policy decisions, along with the date, time and previous readings. Investors use it to know when new information about the economy is due.
Where can I check the India economic calendar today?
MoSPI publishes an advance release calendar for its data, and the RBI and the Office of the Economic Adviser publish theirs. Our daily Economic Calendar India page lists the verified releases for the day.
What does IIP growth of 6.7% mean?
It means India’s industrial output in September 2026 was 6.7% higher than in September 2025, based on the 2022-23 base-year index. It covers manufacturing, mining, and electricity and gas supply, with manufacturing carrying the highest weight.
What is the difference between IIP, CPI and WPI?
IIP measures how much industry is producing. CPI (Consumer Price Index) measures retail inflation faced by households, and WPI measures wholesale prices. You can see how we covered CPI in our Economic Calendar India page for 12 October 2026, and read about another activity gauge in What is Purchasing Managers Index (PMI)?
How can economic data affect Nifty 50 and Sensex?
Data can change expectations about interest rates, company earnings and the rupee, which in turn can influence the Nifty 50 and Sensex. Reactions vary and are never certain.
Conclusion
India’s industrial output grew 6.7% YoY in September 2026, slower than August’s 8.0% quick estimate and below the 7.3% Reuters poll cited by Finimize. Manufacturing (7.6%) and electricity and gas (11.2%) did most of the lifting. Since the new IIP series began in April, growth has ranged from 4.9% to 8.0% at first release, and revisions have often moved the numbers upward, so the next release matters as much as today’s.
Data sources: IIP figures from MoSPI/NSO releases as reported by IANS and Free Press Journal (September), All India Radio (August), Deccan Chronicle (July), PIB (June), PIB (May) and New Kerala (April). Poll forecast and timing as reported by Finimize. Release date confirmed from the MoSPI advance release calendar. The official MoSPI press release page could not be accessed directly at the time of writing, and figures may be revised.
This article is for informational and educational purposes only and does not constitute investment advice. Please consult a SEBI-registered investment advisor before making any trading or investment decisions.
RELATED POSTS
View all


Economic Calendar India Today – Friday, 16 October 2026: RBI Forex Reserves Data
October 16, 2026 | by NammaStockMarket
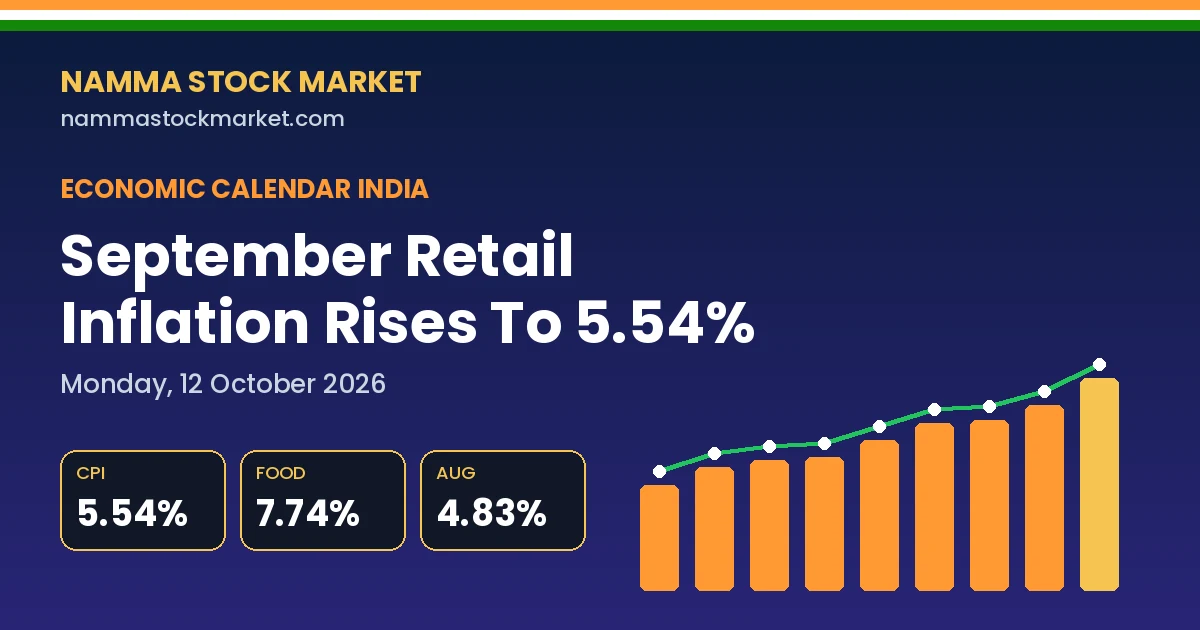
Economic Calendar India Today – Monday, 12 October 2026: CPI Inflation Data Released
October 12, 2026 | by NammaStockMarket
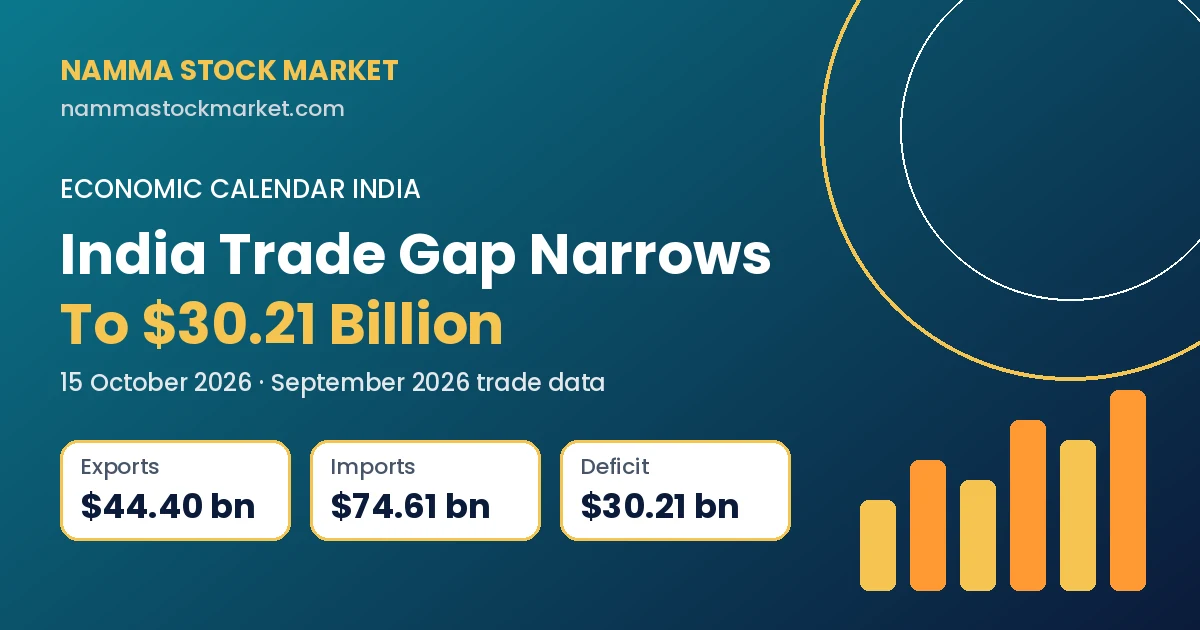
Economic Calendar India Today – Thursday, 15 October 2026: Trade Data Released
October 15, 2026 | by NammaStockMarket