

Economic Calendar India Today – Monday, 16 November 2026: WPI Inflation Rises to 12.29% in October
November 16, 2026 | by NammaStockMarket
Monday, 16 November 2026 (IST) | Last updated 5:50 PM IST
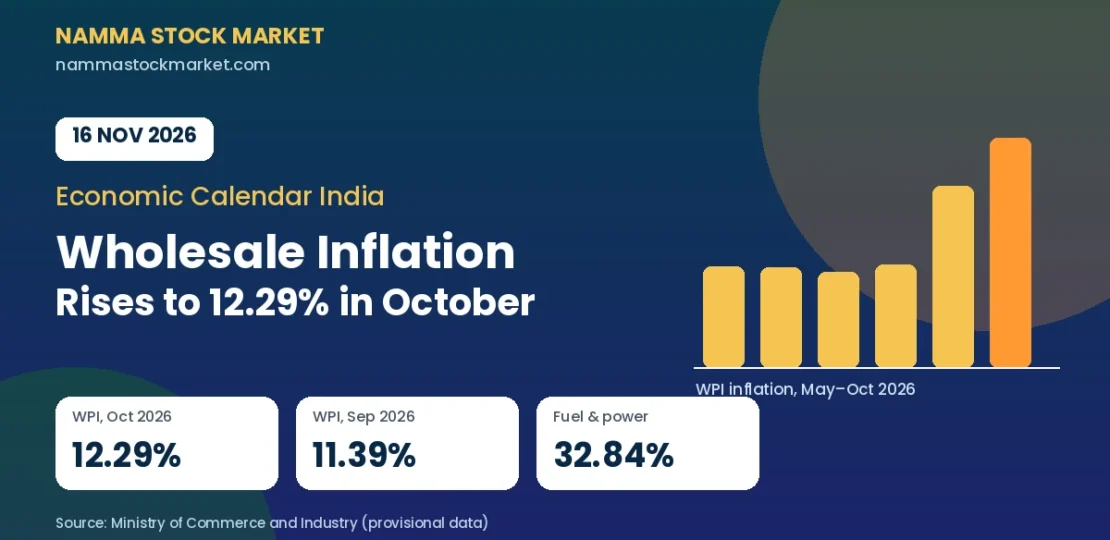
Welcome to today’s Economic Calendar India update. The one Indian data release scheduled for today is the Wholesale Price Index (WPI), which tells us how fast prices are rising at the wholesale level, for October 2026. It is already out: WPI inflation rose to 12.29% year-on-year, up from 11.39% in September. This page covers the numbers, the recent trend and why the link between economic data and the stock market matters for Indian investors.
Economic Calendar India – Today’s Key Events
| Time (IST) | Economic Indicator | Reporting Period | Previous Data | Forecast | Why It Matters |
|---|---|---|---|---|---|
| About 12:00 noon* | WPI inflation, all commodities (YoY). Released: 12.29% (provisional) | October 2026 | 11.39% | 12.10%** | Shows price pressure at the factory and wholesale level, which often feeds into retail prices and the RBI’s thinking on interest rates |
Release time as per the advance release calendar of the Office of the Economic Adviser (DPIIT); news reports of the figure began appearing in the afternoon. *Consensus as shown on Investing.com’s economic calendar; this is a market estimate, not an official number. ICRA had estimated 11.8%.
No other Indian economic indicator was verified for release today. October’s trade data came out on Friday, 13 November, and retail inflation (CPI) came out on 12 November.
Understanding Today’s Economic Indicators
Wholesale Price Index (WPI) Inflation
What it is. WPI tracks the change in prices of goods when they are sold in bulk between businesses, before they reach the shop shelf. Think of the price a trader pays at the mandi or the factory gate, not the price you pay at your local kirana store. Retail inflation is tracked separately by the Consumer Price Index (CPI).
A new series. From the May 2026 release, the Ministry of Commerce and Industry moved WPI to a new base year of 2022-23, with a wider basket of 957 items (earlier 697). Crude petroleum and natural gas now sit under fuel and power instead of primary articles. Because of this, comparisons with older WPI data should be done with care, and this article uses only readings from the new series.
What the October 2026 data says (provisional):
| Group | October 2026 | September 2026 | Change (percentage points) |
|---|---|---|---|
| All commodities (headline) | 12.29% | 11.39% | +0.90 |
| Primary articles | 9.24% | 8.67% | +0.57 |
| Fuel and power | 32.84% | 25.85% | +6.99 |
| Manufactured products | 9.54% | 9.76% | -0.22 |
| WPI Food Index | 8.58% | 8.66% | -0.08 |
The All Commodities index stood at 113.3 in October against 112.5 in September, a month-on-month rise of about 0.7%. Fuel and power did most of the work. Within it, mineral oils (petroleum products) inflation was 45.57%, crude petroleum and natural gas was 70.80%, and electricity moved to 8.06% from a small decline of 0.43% a month earlier. ICRA’s principal economist noted that fuel and power accounted for 83 basis points of the 90 basis point rise in the headline number (one basis point is one-hundredth of a percentage point).
The Commerce Ministry said mineral oils, crude petroleum and natural gas, electricity, food articles, basic metals, chemicals, food products, non-food articles, textiles and rubber and plastic products were the drivers of October’s WPI inflation. Manufactured products, which carry about 63% of the basket, eased slightly. Cumulative WPI inflation for April-October 2026-27 was 10.14%.
What to watch. Whether fuel prices stay high, since they dominate the headline number, and whether food and manufactured-goods inflation stays at current levels. The next WPI release, for November 2026, is due on 14 December 2026.
Possible market implications (educational only). Higher wholesale prices can raise input costs for companies in sectors such as chemicals, metals, textiles, paints and FMCG, and may squeeze profit margins if firms cannot pass on the costs. Rising fuel costs can also affect the rupee through a bigger import bill. Bond investors and banking stocks watch inflation closely because it shapes expectations about the Reserve Bank of India’s (RBI) repo rate, the rate at which RBI lends to banks. How the Nifty 50 and Sensex react on any day depends on many other factors as well.
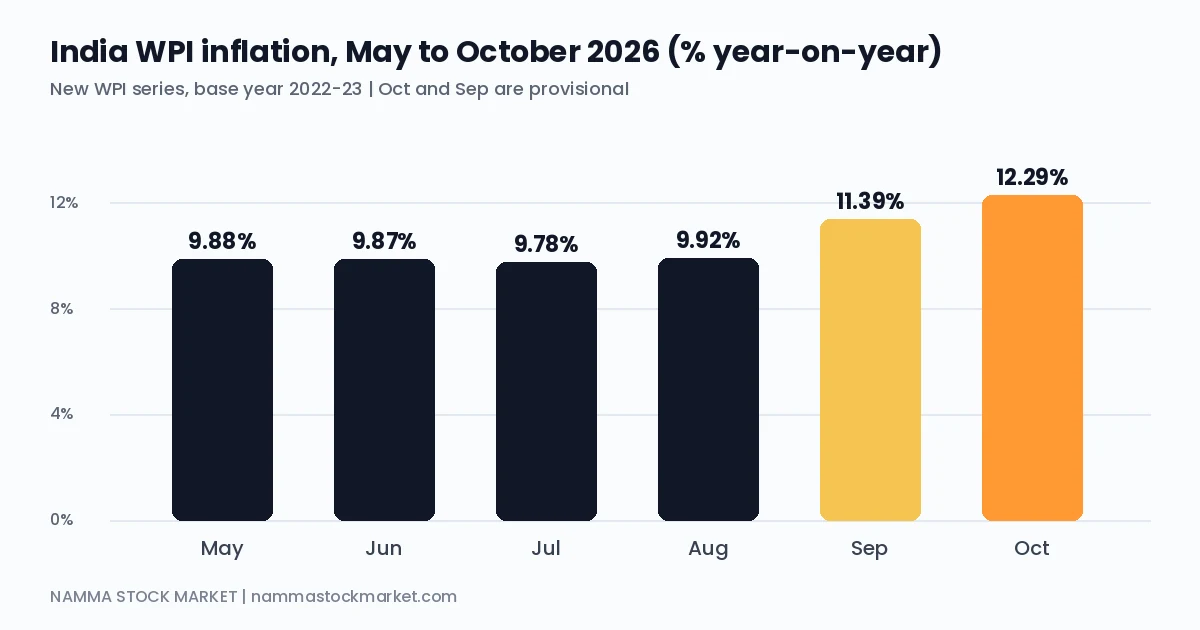
Historical Data of WPI Inflation (All Commodities, YoY)
The table below uses the new 2022-23 base series, year-on-year, for the six months from May to October 2026.
| Reporting Period | Actual Value | Previous Period’s Value | Interpretation |
|---|---|---|---|
| October 2026 (provisional) | 12.29% | 11.39% | Highest in this series; fuel and power inflation at 32.84% |
| September 2026 (provisional) | 11.39% | 9.92% | Sharp jump from August; food and manufactured goods also rose |
| August 2026 (final) | 9.92% | 9.78% | Small rise; fuel and power inflation picked up to 22.93% |
| July 2026 (final) | 9.78% | 9.87% | Slight easing as fuel and power inflation cooled |
| June 2026 (as first published) | 9.87% | 9.88% | Little change; food and minerals prices pushed up |
| May 2026 (final) | 9.88% | 8.26% | First reading under the new series; fuel prices surged |
Notes: May’s figure was revised from 9.68% (provisional) to 9.88% (final). June is shown as first published (9.87%); we could not verify a final revision, and one data tracker shows 9.97%. April’s 8.26% is as reported alongside the May release. September and October are provisional and may be revised once more complete data comes in. Figures are annual (year-on-year) inflation rates and are not seasonally adjusted.
In simple words. For four months from May to August, WPI inflation stayed close to 10%. Then it moved up to 11.39% in September and 12.29% in October, mainly because fuel and power became costlier. One economist quoted in the media sees October as a possible peak, but warned that oil prices and the pass-through of costs remain risks. That is a view, not a certainty.
How Could Today’s Economic Data Affect the Indian Stock Market?
Economic data does not move markets in a straight line, but there are some common channels worth understanding:
- Inflation and interest-rate expectations. If both wholesale and retail inflation stay high, markets may expect the RBI to keep rates steady or higher for longer. This can matter for rate-sensitive areas such as banks, NBFCs and real estate.
- Input costs and company margins. Higher wholesale prices can raise costs for manufacturers. Whether they can pass this on to customers varies by sector.
- Bond yields. Persistent inflation can push up government bond yields, which in turn affects borrowing costs.
- The rupee. Higher fuel and import costs can add to pressure on the rupee, which matters for importers, exporters and foreign investors such as FIIs (Foreign Institutional Investors, large overseas funds investing in Indian shares).
- Growth and consumption. If wholesale prices later feed into retail prices, household budgets can come under pressure, which can affect demand.
These are examples of possible relationships, not guaranteed reactions. Market moves also depend on global cues, company results, FII and DII (Domestic Institutional Investors, such as Indian mutual funds and insurers) flows and many other factors. You can read our pre-market report for 16 November 2026 for the day’s market setup, and our Economic Calendar India update for 12 November 2026 for the October retail inflation numbers.
What Should Indian Investors Watch Today?
- Fuel and power prices. They explain most of October’s jump, so crude oil and gas price trends are worth following.
- WPI against CPI. Retail inflation (CPI) was 6.09% in October, above the RBI’s 6% upper tolerance limit. Wholesale inflation of 12.29% shows cost pressure further up the supply chain.
- The RBI’s next policy meeting. The next Monetary Policy Committee decision is scheduled for 4 December 2026, according to a published release calendar. The repo rate stands at 5.50%.
- Revisions. September and October WPI are provisional, so numbers can change in later releases.
- Sector cost pressures. Companies in the chemicals, metals and textiles space may discuss input costs in their quarterly results.
Frequently Asked Questions
What is the Economic Calendar India?
The Economic Calendar India is a schedule of important Indian data releases and policy events, such as inflation, GDP, industrial production, trade data and RBI decisions, along with their previous and actual readings.
Where can I check India’s economic calendar today?
Official release dates are published by bodies such as MoSPI (for CPI, IIP and GDP), the Office of the Economic Adviser under DPIIT (for WPI), the Ministry of Commerce and Industry (for trade data) and the RBI (for policy dates and forex reserves). This page also tracks the day’s releases.
What is the difference between WPI and CPI?
WPI measures price changes at the wholesale level, while CPI measures prices paid by consumers. The RBI uses CPI as its main inflation guide, while WPI is useful for understanding cost pressures for businesses.
Which indicators matter most for the Indian stock market?
Many investors follow CPI and WPI inflation, GDP growth, IIP (Index of Industrial Production), PMI (Purchasing Managers’ Index), trade data, forex reserves and RBI policy decisions. Their importance changes with the economic situation.
How can economic data affect Nifty 50 and Sensex?
Data can change expectations about interest rates, company earnings and the rupee, which can influence the Nifty 50 and Sensex. Reactions differ from one release to another and are never certain.
Conclusion
India’s wholesale inflation rose to 12.29% in October 2026 from 11.39% in September, with fuel and power inflation of 32.84% accounting for most of the increase. Manufactured products and food inflation eased slightly. With retail inflation also above the RBI’s upper limit, the fuel price trend, the November WPI release on 14 December and the RBI’s December policy meeting are the next markers to follow.
Data sources: October 2026 WPI figures are the Ministry of Commerce and Industry’s provisional release as reported by The Tribune, Forbes India, Xinhua, Oneindia and Kotak Neo. Earlier months are from reports on the official releases by The Tribune (July), The Tribune (August), The Tribune (September) and The Tribune (May, new series). Official WPI releases are published by the Office of the Economic Adviser, DPIIT. Release timing from the indiainflation.com release calendar; consensus from Investing.com. The official press release could not be accessed directly at the time of writing, and provisional figures may be revised.
This article is for informational and educational purposes only and does not constitute investment advice. Please consult a SEBI-registered investment advisor before making any trading or investment decisions.
RELATED POSTS
View all

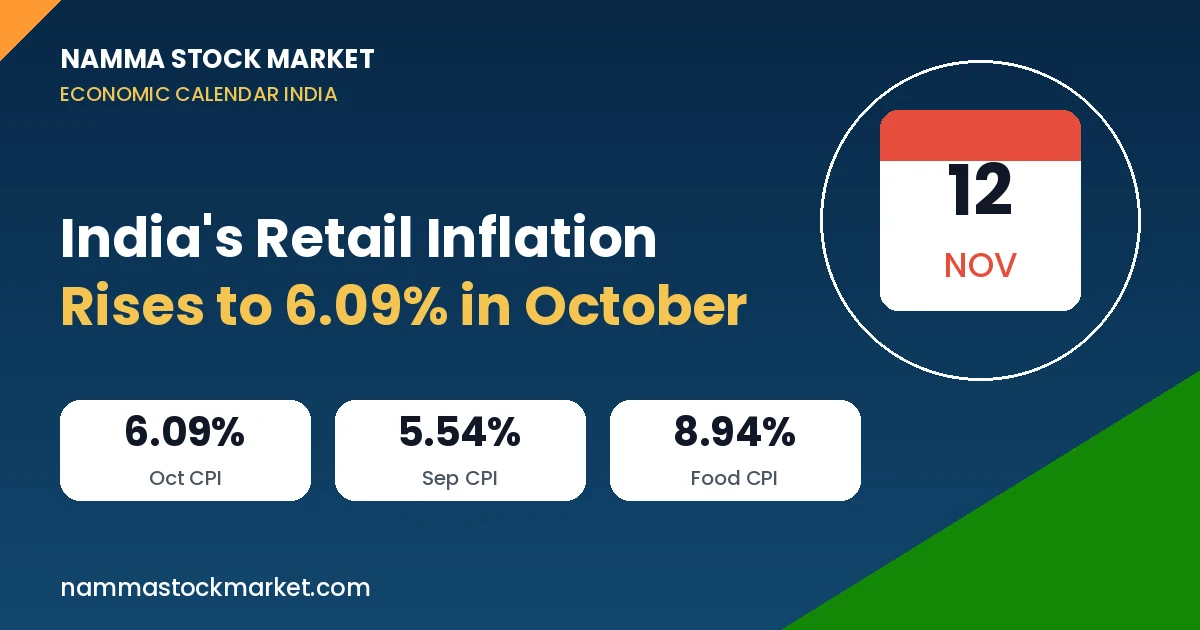
Economic Calendar India Today – Thursday, 12 November 2026: CPI Inflation Hits 6.09% in October
November 12, 2026 | by NammaStockMarket
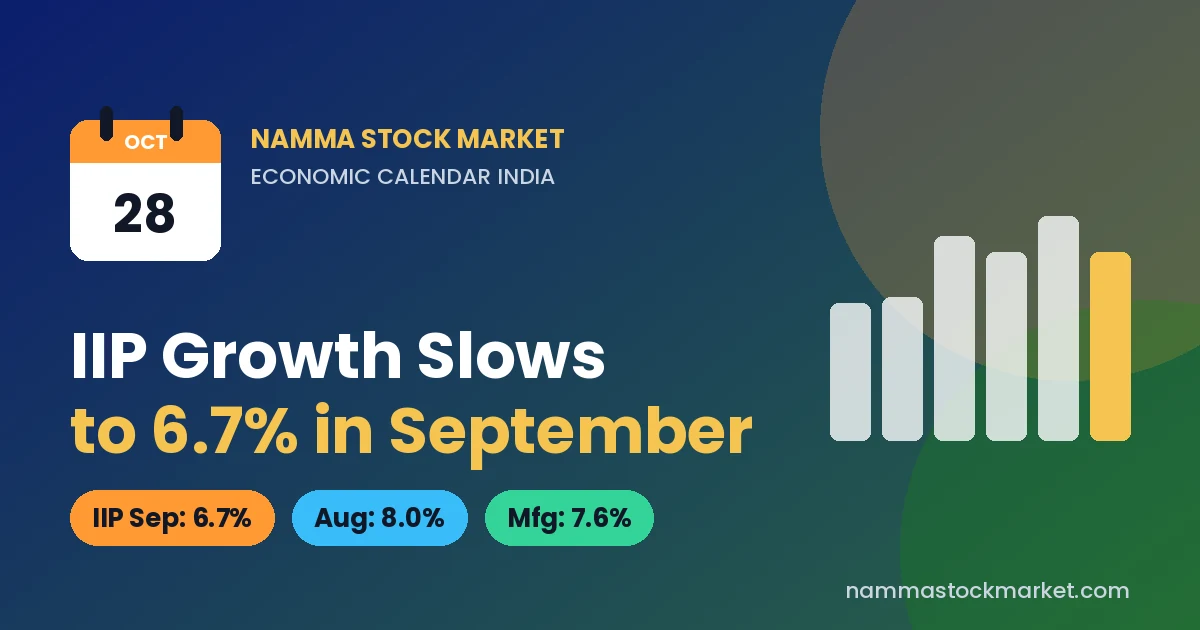
Economic Calendar India Today – Wednesday, 28 October 2026: IIP Data for September Released
October 28, 2026 | by NammaStockMarket
Economic Calendar India Today – Monday, 12 October 2026: CPI Inflation Data Released
October 12, 2026 | by NammaStockMarket