

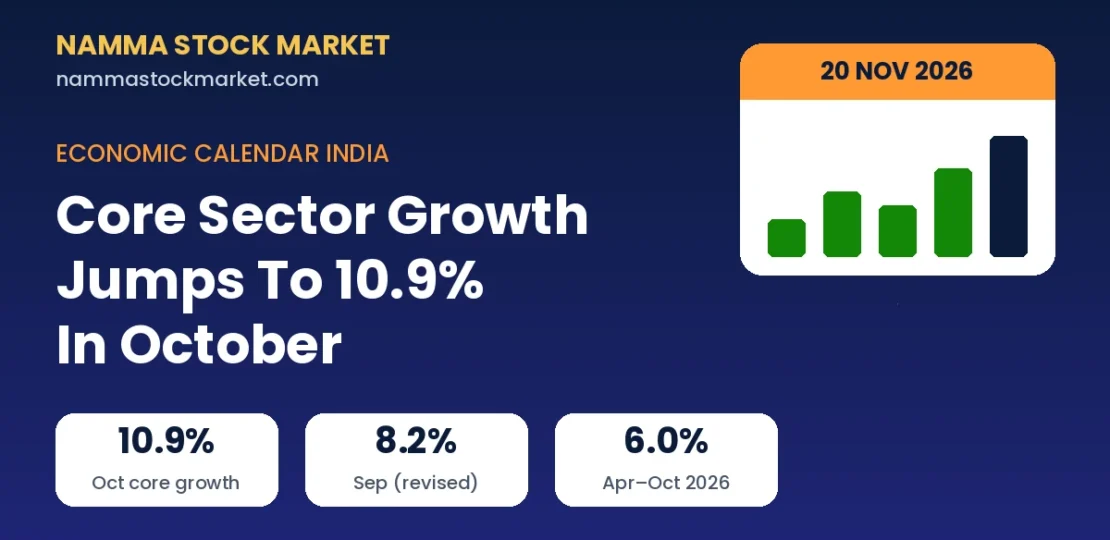
Economic Calendar India Today – Friday, 20 November 2026: Core Sector Growth Jumps to 10.9% in October
November 20, 2026 | by NammaStockMarket
Friday, 20 November 2026 (IST) | Last updated 5:44 PM IST
Welcome to today’s Economic Calendar India update. Two Indian data points are on the list today. The first is the Index of Eight Core Industries for October 2026, which the Ministry of Commerce and Industry has already released. The second is the RBI’s weekly forex reserves figure for the week ended 13 November 2026, which comes out in the evening. This page explains what the numbers mean in simple words and how they connect to the Indian stock market.
Economic Calendar India – Today’s Key Events
| Time (IST) | Economic Indicator | Reporting Period | Previous Data | Forecast | Why It Matters |
|---|---|---|---|---|---|
| Released (time not confirmed) | Index of Eight Core Industries. Released: +10.9% YoY (provisional) | October 2026 | +8.2% (Sep, revised) | Not available | Shows how coal, power, steel, cement and other basic industries performed. These sectors feed into industrial output (IIP). |
| Around 5:00 PM* | RBI Forex Reserves. Status: due today; figure not verified at the time of writing | Week ended 13 Nov 2026 | $719.55 bn (week ended 6 Nov) | Not available | Reserves help the RBI manage rupee swings and signal external-sector strength. |
*The RBI normally publishes its Weekly Statistical Supplement on Fridays in the evening. The exact time is not officially confirmed. No reliable consensus forecast was available for either release.
Understanding Today’s Economic Indicators
Index of Eight Core Industries (October 2026)
What it is. The core industries index tracks the output of eight basic industries: coal, crude oil, natural gas, refinery products, fertilisers, steel, cement and electricity. Think of them as the building blocks of the economy. Together they carry roughly 40% of the weight in the Index of Industrial Production (IIP), so the core data is often seen as an early hint of what IIP may show. The series now uses the 2022-23 base year.
What was released. Core industries grew 10.9% year-on-year in October 2026 (provisional), faster than the revised 8.2% for September. Growth for April to October 2026 stands at 6.0%, compared with 2.3% in the same period last year. The government also revised the September index to 118.6 from 118.3.
What drove it. Six of the nine industries listed in the release grew in October:
| Industry | Oct 2026 Growth (YoY) | Sep 2026 Growth (YoY) |
|---|---|---|
| Iron ore | +26.4% | +18.4% |
| Coal | +23.1% | +10.7% |
| Electricity | +21.6% | +12.6% |
| Cement | +15.4% | +10.1% |
| Steel | +7.3% | +5.6% |
| Refinery products | +3.4% | +8.7% |
| Natural gas | -7.6% | Not available |
| Crude oil | -4.1% | Not available |
| Fertilisers | -12.2% | Not available |
What to watch. A big part of October’s jump may come from a weak base: core growth in October 2025 was only 0.8% on the same base. So some of the headline strength reflects last year’s low starting point. Also notice that natural gas, crude oil and fertilisers are still shrinking.
Possible market angle. Strong core output can support sentiment towards sectors linked to infrastructure and power demand, such as cement, steel, coal and electricity companies. It can also hint at better freight and capex activity. Markets usually look at many data points together, so one release rarely decides direction.
RBI Forex Reserves (Week Ended 13 November 2026)
What it is. Forex reserves are the foreign currency assets, gold and other reserves held by the Reserve Bank of India. They work like a safety cushion that lets the RBI step in when the rupee moves sharply and helps India meet its payment needs abroad.
Previous reading. In the week ended 6 November 2026, reserves rose $2.49 billion to $719.547 billion, driven mainly by gold, which rose $2.205 billion to $104.796 billion. Foreign currency assets rose $232 million to $591.350 billion. Reserves touched a record $785.7 billion in the week ended 4 September 2026.
What to watch. Reserves move for two main reasons: the RBI buying or selling dollars, and changes in the value of gold and other currencies held. So a weekly rise or fall does not always mean the RBI acted in the market.
Possible market angle. Comfortable reserves can support confidence in the rupee and in India’s external position. Rupee moves, in turn, matter for importers, exporters, IT companies and foreign investors (FIIs) who track returns in dollar terms.
Historical Data of Index of Eight Core Industries
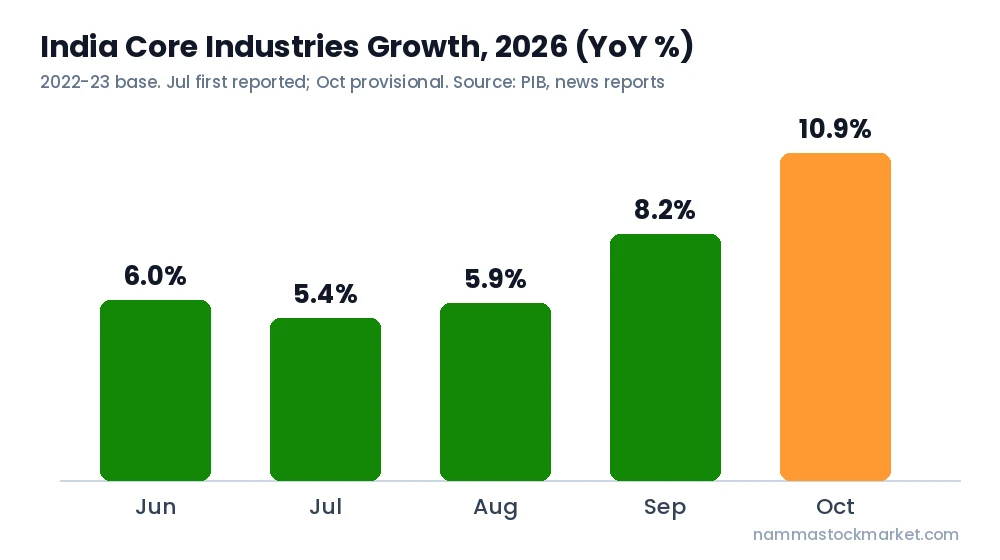
All figures below use the 2022-23 base year and are year-on-year growth rates. Earlier months on the old 2011-12 base are not directly comparable, so they are left out. Only five consecutive months could be verified on the new base from published reports, plus the year-ago October reading. We have not estimated any missing value.
| Reporting Period | Actual Value | Previous Period’s Value | Interpretation |
|---|---|---|---|
| June 2026 | +6.0% (revised from +5.0%) | Not available | Revised up after the provisional estimate |
| July 2026 | +5.4% (provisional, as first reported) | +6.0% | Growth cooled slightly |
| August 2026 | +5.9% (revised; first reported +4.8%) | +5.4% | Revision lifted the reading |
| September 2026 | +8.2% (revised; first reported +7.9%) | +5.9% | Sharp pick-up in coal and power |
| October 2026 | +10.9% (provisional) | +8.2% | Highest of the months listed; iron ore, coal and electricity lead |
| October 2025 (year-ago) | +0.8% | Not available | Low base that flatters the October 2026 growth |
In simple words, core growth was steady at around 5-6% in the middle of the year, then picked up in September and October. Provisional numbers are often revised, so the October figure may change when the next release comes out. Source: Press Information Bureau, with figures cross-checked against Business Standard and BusinessToday.
Historical Data of RBI Forex Reserves
Total reserves in US dollar billions, as reported by the RBI for each week. Weeks are not all consecutive: the record-high week is included for context.
| Week Ended | Total Reserves ($ bn) | Previous Week’s Value ($ bn) | Interpretation |
|---|---|---|---|
| 4 September 2026 | 785.71 | Not available | All-time high after special diaspora-deposit swap inflows |
| 9 October 2026 | 726.03 | Not available | Fell $8.58 bn as the RBI defended the rupee |
| 16 October 2026 | 721.02 | 726.03 | Another decline |
| 23 October 2026 | 719.75 | 721.02 | Fall slowed to $1.27 bn |
| 30 October 2026 | 717.06 | 719.75 | Another weekly decline |
| 6 November 2026 | 719.55 | 717.06 | First rise after the falls, helped by gold |
Reserves fell by about $66 billion from the September peak to the early-November reading, and the pace of decline slowed in recent weeks. Gold price changes can move the total even when the RBI does nothing in the currency market. Sources: RBI Weekly Statistical Supplement, Free Press Journal and All India Radio.
How Could Today’s Economic Data Affect the Indian Stock Market?
Data does not move markets by itself. What matters is how it changes expectations. Here are some possible links, not guaranteed reactions:
- Core industries to activity: Strong core output suggests that factories, power plants and construction are busy. That can support the view that industrial output (IIP) and growth are holding up, which may matter for Nifty 50 and Sensex companies in capital goods, metals and cement.
- Core industries to inflation and rates: Faster growth can add to demand, but the RBI looks at inflation first. For context, see our reports on CPI inflation in October and WPI inflation.
- Forex reserves to rupee: Higher reserves give the RBI more room to smooth rupee moves. Our earlier note on the forex reserves for the week ended 6 November has the background.
- Bond yields and banks: Expectations about growth and the rupee can influence government bond yields, which in turn matter for banking stocks.
What Should Indian Investors Watch Today?
- The October core growth of 10.9% is provisional. Watch for revisions in the next release, since September itself was revised up from 7.9% to 8.2%.
- Check how much of the jump comes from the low base of October 2025.
- Note that natural gas, crude oil and fertilisers are still contracting, so the strength is not broad-based.
- Look at the RBI’s forex reserves release this evening, and whether the recent fall from the September peak continues or the early-November rise holds.
- Wait for IIP data for October to see whether the core sector strength carries into overall industrial output. The IIP release date should be confirmed on the MoSPI release calendar.
Frequently Asked Questions
What is the Economic Calendar India?
It is a schedule of upcoming and recent Indian economic data releases such as inflation, GDP, industrial output, PMI, trade data and RBI announcements, so investors know when new numbers about the economy are due.
Where can I check India’s economic calendar today?
You can check the release pages of MoSPI, the RBI, the Office of the Economic Adviser and PIB, or follow this page, which lists only the releases we could verify for the day.
What are the eight core industries?
They are coal, crude oil, natural gas, refinery products, fertilisers, steel, cement and electricity. Together they carry around 40% of the weight in the IIP.
Why do forex reserves matter for the rupee?
Reserves let the RBI sell dollars when the rupee is under pressure. Larger reserves generally mean more room to manage sharp moves.
How can economic data affect the Nifty 50 and Sensex?
Data can change expectations about growth, inflation and interest rates, which can influence how investors value companies. The effect is not fixed, and markets often react to the gap between the actual number and what was expected.
Conclusion
Today’s Economic Calendar India shows two releases. Core industries grew 10.9% in October 2026, the highest of the months covered here, helped by iron ore, coal, electricity and cement, though part of it reflects a low base. The RBI’s forex reserves for the week ended 13 November are due this evening, after the early-November rise to $719.55 billion.
Data sources: Press Information Bureau (Ministry of Commerce and Industry), RBI Weekly Statistical Supplement, with figures cross-checked against the news reports linked above. The release schedule was checked against official release calendars and news reports. Core industries figures for the latest months are provisional and may be revised.
This article is for informational and educational purposes only and does not constitute investment advice. Please consult a SEBI-registered investment advisor before making any trading or investment decisions.
RELATED POSTS
View all

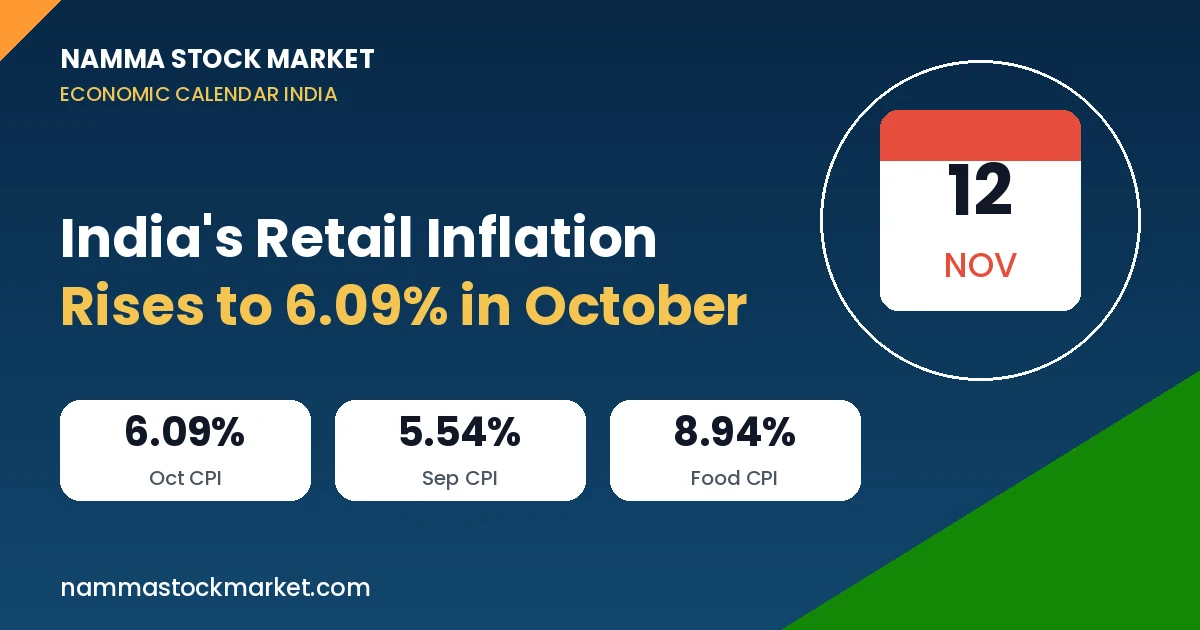
Economic Calendar India Today – Thursday, 12 November 2026: CPI Inflation Hits 6.09% in October
November 12, 2026 | by NammaStockMarket
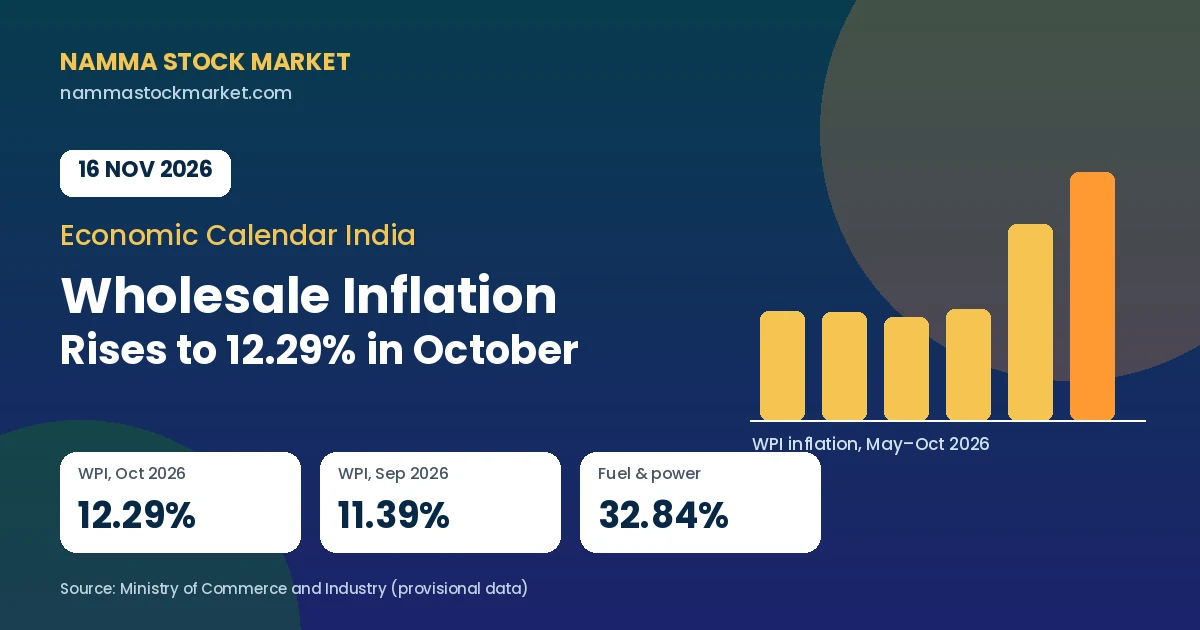
Economic Calendar India Today – Monday, 16 November 2026: WPI Inflation Rises to 12.29% in October
November 16, 2026 | by NammaStockMarket

Economic Calendar India Today – Friday, 13 November 2026: RBI Forex Reserves Rise to $719.55 Billion
November 13, 2026 | by NammaStockMarket