

Economic Calendar India Today – Friday, 13 November 2026: RBI Forex Reserves Rise to $719.55 Billion
November 13, 2026 | by NammaStockMarket

Friday, 13 November 2026 (IST) | Last updated 5:50 PM IST
Welcome to today’s Economic Calendar India update. The one Indian data release we could verify for today is the Reserve Bank of India’s (RBI) weekly forex reserves figure for the week ended 6 November 2026. The number is already out: India’s total foreign exchange reserves rose to about $719.55 billion, up roughly $2.49 billion from a week earlier. This page explains what the figure shows, how it compares with recent weeks, and why Indian stock market investors keep an eye on it.
Economic Calendar India – Today’s Key Events
| Time (IST) | Economic Indicator | Reporting Period | Previous Data | Forecast | Why It Matters |
|---|---|---|---|---|---|
| About 5:00 PM* | India Forex Reserves (RBI). Released: $719.55 bn (+$2.49 bn) | Week ended 6 Nov 2026 | $717.06 bn | Not available | Shows the cushion available to manage rupee volatility and pay for imports |
The weekly slot of about 5:00 PM IST is as listed by data providers; the RBI publishes the figure in its Weekly Statistical Supplement. No consensus forecast from a reliable source could be verified for this release.
Some data providers also list the RBI’s fortnightly bank loan and deposit growth numbers for today. We could not verify the latest figures from a reliable source at the time of writing, so we have not included them in the table.
Understanding Today’s Economic Indicators
India Forex Reserves (Weekly)
What it is. Forex reserves are the foreign assets held by the RBI. They include foreign currency assets (mainly dollar and other government securities and deposits), gold, Special Drawing Rights (SDRs, a reserve asset created by the International Monetary Fund) and India’s reserve position at the IMF. The RBI releases the data every Friday for the week ended the previous Friday.
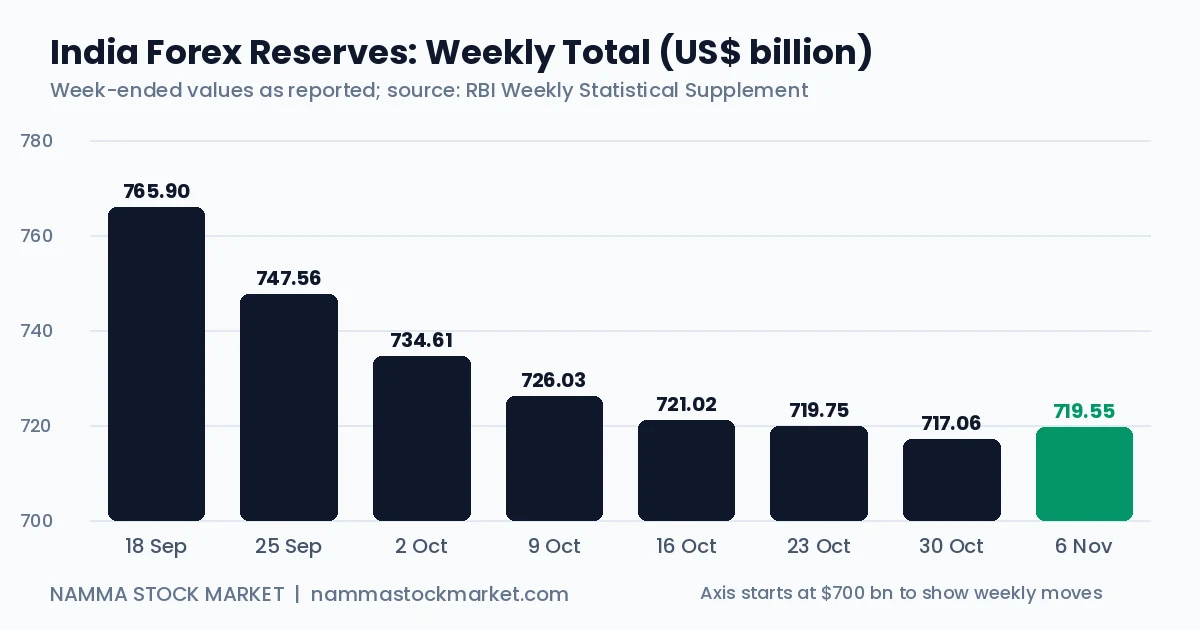
What the latest reading shows. For the week ended 6 November 2026, total reserves were $719.547 billion, a rise of about $2.49 billion over the $717.056 billion of the week ended 30 October. This ends two straight weekly falls. We have not shown the split between foreign currency assets, gold and SDRs, because we could not verify the component figures for this week.
Previous reading. $717.056 billion for the week ended 30 October 2026, a fall of $2.691 billion.
Market expectations. Not available. We have not shown a forecast because no reliable consensus for this release could be verified.
What to watch. Reserves peaked at about $785.7 billion in the week ended 4 September 2026. Since then they have come down by roughly $66 billion, or about 8.4 per cent. A large part of the earlier fall was linked in media reports to the RBI selling dollars to support the rupee, and gold is also valued at market prices, so a change in global gold prices moves the total even when the RBI has not bought or sold anything. The next question is whether this week’s rise is the start of a steadier phase or just a pause.
Possible market implications. Comfortable reserves generally give the RBI room to smooth sharp rupee moves, which can matter for importers, exporters and foreign investors. A rise after weeks of falls can ease some worry about the rupee, while a steady fall can bring attention back to it. For equities, sectors sensitive to the rupee, such as IT services, oil marketing companies and banks, may react differently. These are possible channels, not guaranteed reactions.
Historical Data of India Forex Reserves
The table below shows total forex reserves at the end of each week, in US$ billion, from the sources listed at the end of this article. All figures are weekly totals on the same basis. Figures are as reported for each week and may be revised later by the RBI.
| Week Ended | Total Reserves (US$ bn) | Previous Week (US$ bn) | Interpretation |
|---|---|---|---|
| 6 Nov 2026 | 719.55 | 717.06 | Up $2.49 bn; first rise after two falls |
| 30 Oct 2026 | 717.06 | 719.75 | Down $2.69 bn |
| 23 Oct 2026 | 719.75 | 721.02 | Down $1.27 bn |
| 16 Oct 2026 | 721.02 | 726.03 | Down $5.01 bn |
| 9 Oct 2026 | 726.03 | 734.61 | Down $8.58 bn |
| 2 Oct 2026 | 734.61 | 747.56 | Down $12.95 bn |
| 25 Sep 2026 | 747.56 | 765.90 | Down $18.34 bn; the largest weekly fall in this table |
| 18 Sep 2026 | 765.90 | 780.78 | Down $14.88 bn |
In simple words. Reserves fell every week from the record level in early September until the end of October, and the size of the weekly fall kept shrinking after the sharp drop in the last week of September. The latest week brings a small rise. Even at $719.55 billion, the reserves remain very large in absolute terms.
Source: RBI Weekly Statistical Supplement, with weekly values cross-checked against NewsBytes, Deccan Herald, Finimize, Free Press Journal and ThePrint. The 25 September level is shown as $747.56 billion, which matches the $765.90 billion of the week before less the reported fall of about $18.34 billion.
How Could Today’s Economic Data Affect the Indian Stock Market?
Weekly forex reserves are not a market-moving number the way CPI inflation or an RBI policy decision can be, but they feed into several channels:
- Rupee stability. Large reserves give the RBI more room to step into the currency market during sharp moves. A weaker rupee can raise import costs, including crude oil, which affects inflation and company margins.
- Rate expectations. Currency pressure and inflation together shape how the RBI thinks about interest rates, and that in turn affects bond yields and banking stocks.
- Foreign flows. Foreign institutional investors (FIIs, the big overseas funds that buy and sell Indian shares) watch the rupee and reserves as signs of external-sector strength. Changes in foreign portfolio investor (FPI) flows can influence the Nifty 50 and Sensex.
- Sector effects. Exporters such as IT firms often gain from a weaker rupee, while import-heavy sectors face higher costs.
These are examples of possible relationships. Actual market reactions depend on many other factors at the same time.
For fuller context on recent releases, see our earlier updates: Economic Calendar India – 12 November 2026 (CPI Inflation) and Economic Calendar India – 30 October 2026 (RBI Forex Reserves).
What Should Indian Investors Watch Today?
- Direction of the trend. The first weekly rise after two falls is worth noting, but one week does not make a trend. Next Friday’s reading will help show whether the stabilising continues.
- Gold versus currency assets. Because gold is valued at market prices, part of any weekly change reflects global gold prices and not RBI action.
- Rupee and FPI flows. Reserves, the rupee and foreign investment flows tend to move together. Watching them side by side gives a fuller picture than any single number.
- Inflation backdrop. Retail inflation rose to 6.09% in October, above the RBI’s upper tolerance limit of 6%, so the currency and rate discussion stays closely linked.
Frequently Asked Questions
What is the Economic Calendar India?
It is a schedule of important Indian economic data releases and policy events, such as inflation, GDP, industrial output, PMI, trade data, forex reserves and RBI decisions. It helps investors know when new numbers about the economy are due.
Where can I check India’s economic calendar today?
You can check the official release pages of the RBI, MoSPI and the Office of the Economic Adviser, or follow this page, which lists only the releases we have verified for the day.
Which indicators matter most for the Indian stock market?
Retail inflation (CPI), wholesale inflation (WPI), GDP growth, industrial output (IIP), PMI surveys, trade data and RBI policy decisions usually get the most attention, because they shape views on growth, interest rates and company earnings.
What is the difference between CPI and WPI?
CPI measures the change in prices that households pay at the retail level. WPI measures price changes at the wholesale or factory-gate level, before goods reach the consumer.
How can economic data affect the Nifty 50 and Sensex?
Data can change expectations about growth, inflation and interest rates, which can influence how investors value companies. The effect is not fixed, and markets often react to the gap between the actual number and what was expected.
Conclusion
Today’s verified release is the RBI’s weekly forex reserves for the week ended 6 November 2026: $719.55 billion, up about $2.49 billion after two weekly falls. Reserves are still well below the early-September record, but the fall has slowed sharply. Next on the calendar, wholesale price inflation (WPI) for October is scheduled for 16 November 2026, according to the government’s release schedule.
Data sources: RBI Weekly Statistical Supplement, with figures cross-checked against the news reports linked above. The release schedule was checked against the Business Standard weekly policy watch and the Office of the Economic Adviser’s advance release calendar. Figures may be revised by the RBI.
This article is for informational and educational purposes only and does not constitute investment advice. Please consult a SEBI-registered investment advisor before making any trading or investment decisions.
RELATED POSTS
View all

Economic Calendar India Today – Monday, 12 October 2026: CPI Inflation Data Released
October 12, 2026 | by NammaStockMarket
Economic Calendar India Today – Thursday, 15 October 2026: Trade Data Released
October 15, 2026 | by NammaStockMarket

Economic Calendar India Today – Friday, 16 October 2026: RBI Forex Reserves Data
October 16, 2026 | by NammaStockMarket